The Home Inspection Dashboard in Excel tracks 5 core KPIs across 5 interactive analysis pages with 16 pre-built pivot-driven charts and dynamic slicers. Home inspection companies that previously pieced together flat spreadsheets can now see inspector completion rates, defect volumes by property type, regional revenue breakdowns, and monthly trends in a single Excel workbook. Setup takes under 10 minutes — paste your records into the Data sheet, click Refresh All, and every chart updates automatically.
🌍 Join 8,400+ teams in 40+ countries using NextGenTemplates to replace paid SaaS tools with one-time-purchase Excel, Google Sheets, Power BI, and HTML templates.
✅ Instant download · One-time payment · No subscription · No per-user fees · Lifetime access
Key Features of Home Inspection Dashboard in Excel
The Home Inspection Dashboard in Excel delivers structured, pivot-driven analytics across seven worksheets. The five analysis pages cover revenue performance, inspector productivity, property defect patterns, service category mix, and month-over-month revenue trends. Here’s what makes it a complete reporting system:
- 5 KPI summary cards — Total Inspection Fee, Total Records, Total Defects Found, Net Revenue, and Avg. Client Rating visible on the Overview page for instant high-level status.
- 16 pre-built charts covering revenue by month and region, records by service type and inspector, defects by property type, completion % by inspector, and monthly revenue trends — all updating with one click.
- Dynamic slicers on the Overview page let you filter the entire dashboard by region, inspector, service type, property type, or status without writing a single formula.
- Pivot-table architecture — every chart draws from pivot tables in the Support sheet. Click Data → Refresh All in the Excel ribbon and all charts refresh in seconds after you add new records.
- No macros or VBA required — built with standard Excel pivot tables, pivot charts, and slicers. Works in Excel 2016 and later including Microsoft 365 on Windows and Mac.
- Structured Data Sheet with a clean column format matching the sample data — just paste your records and the dashboard does the rest.
According to Microsoft’s Excel documentation, pivot tables are one of the most efficient ways to summarize and analyze large datasets — and this dashboard leverages them fully to give you instant, refreshable analytics from any inspection dataset size.
Dashboard Pages Explanation
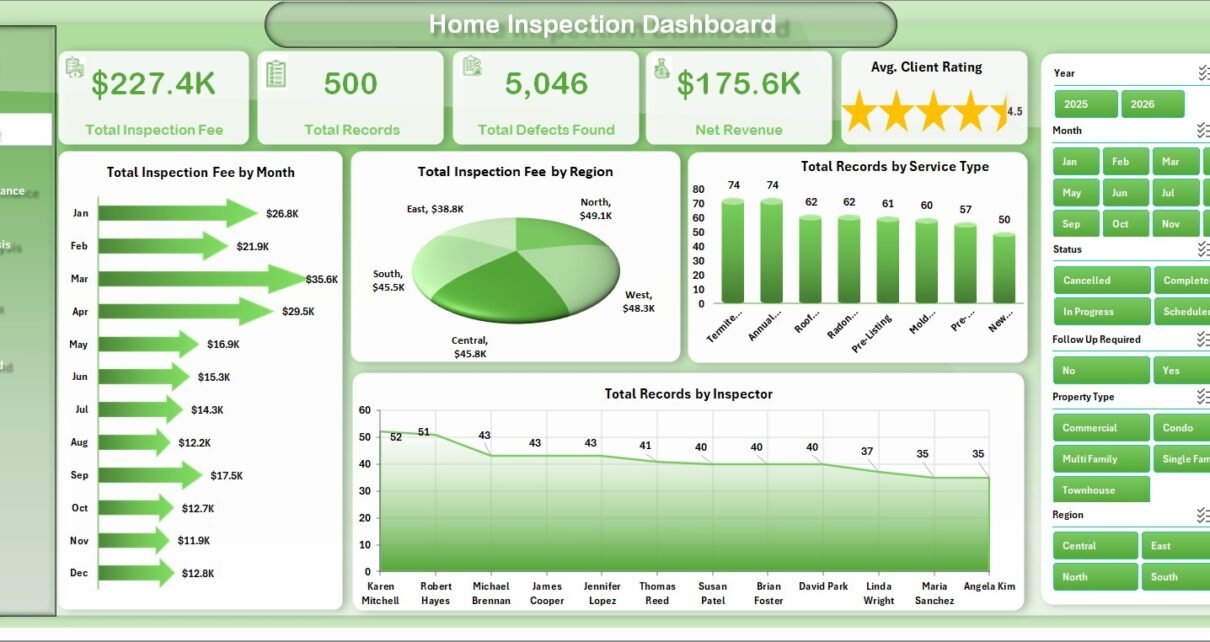
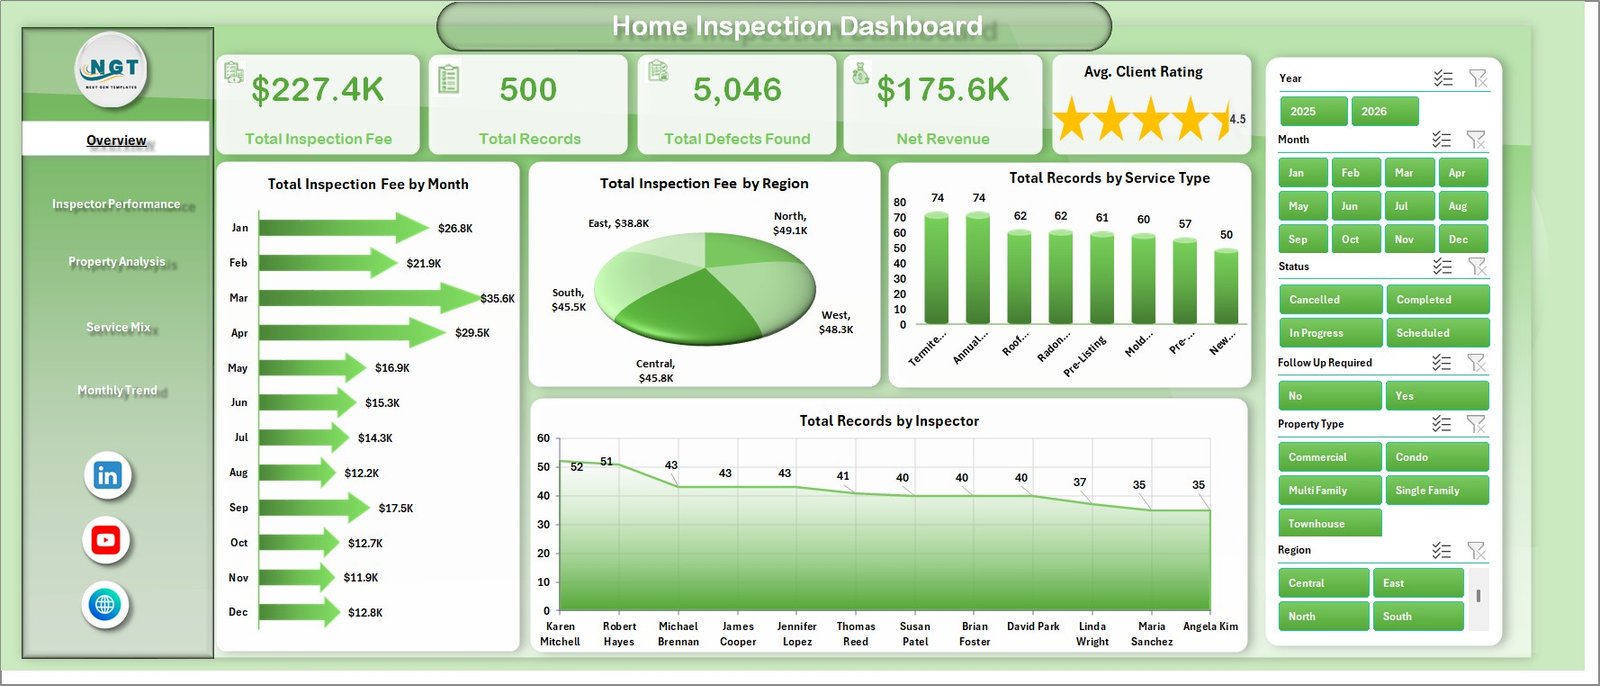
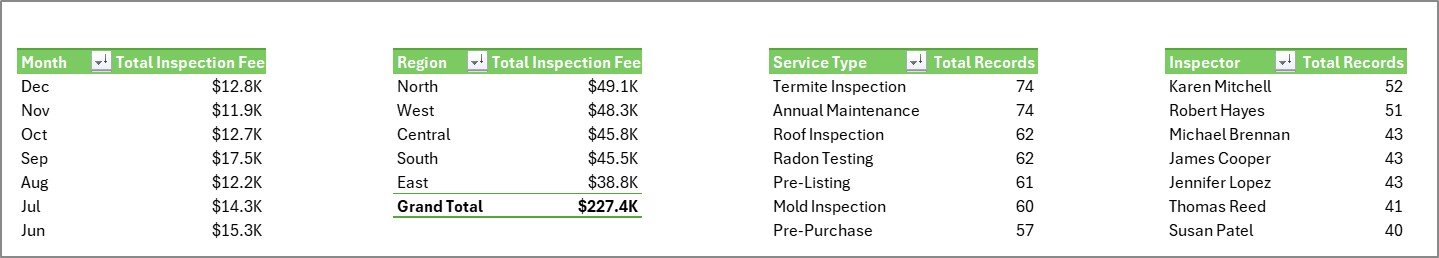
1. Overview Page
The main command center displays five KPI cards at the top (Total Inspection Fee, Total Records, Total Defects Found, Net Revenue, Avg. Client Rating). Four charts provide high-level analysis: Total Inspection Fee by Month reveals revenue seasonality across the year; Total Inspection Fee by Region surfaces geographic performance differences; Total Records by Service Type shows which service categories drive the most volume; Total Records by Inspector compares inspector workload distribution across the team. Dynamic slicers filter the entire page view instantly.
Home Inspection Dashboard
2. Inspector Performance Page
Four charts analyze inspector-level productivity in detail: Avg. Client Rating by Inspector shows quality scores per team member; Total Records by Property Type breaks down each inspector’s case mix across residential, commercial, and other property categories; Completion % by Inspector tracks job completion rates to flag bottlenecks; Net Revenue by Inspector measures each inspector’s revenue contribution to the business.
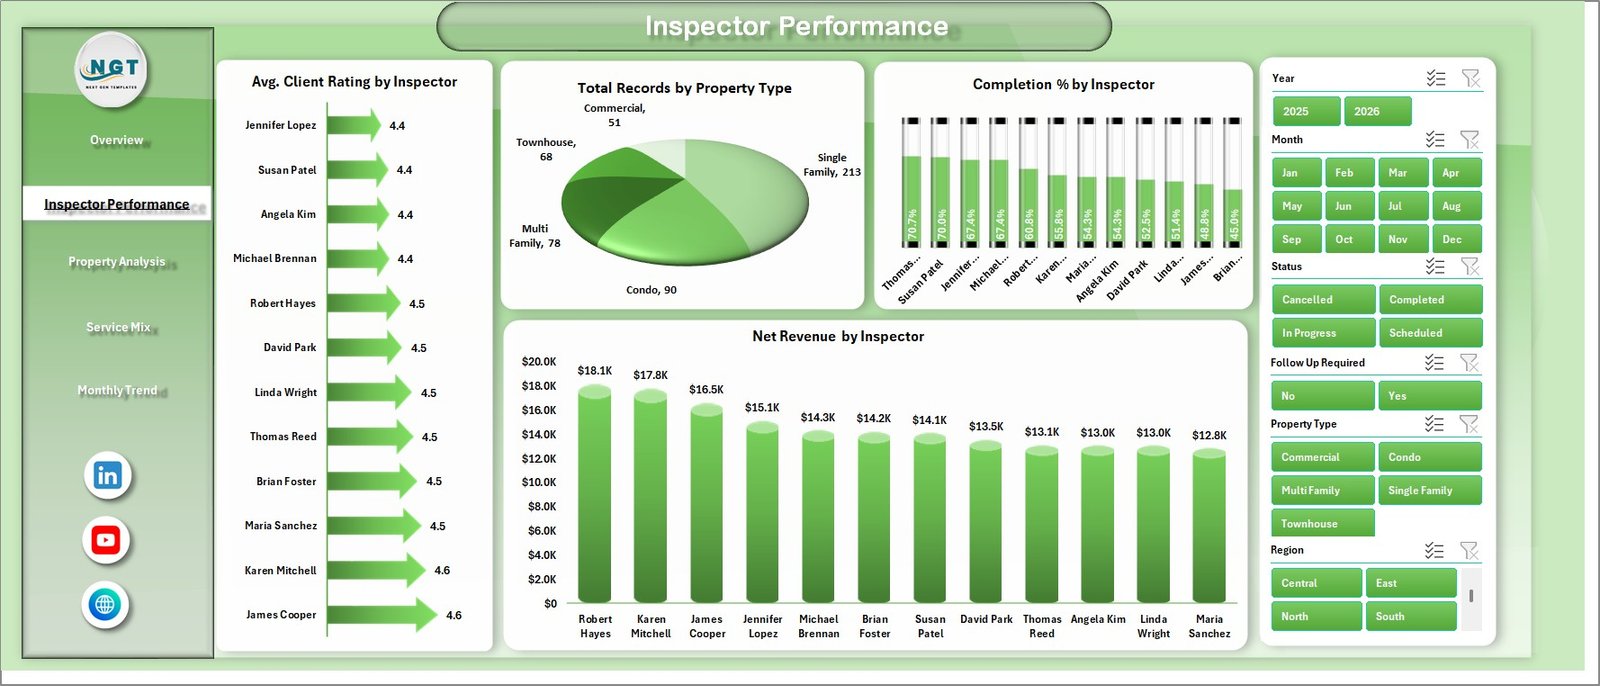
Inspector Performance
3. Property Analysis Page
Focuses on property-level patterns: Total Defects Found by Property Type identifies which property categories generate the highest defect volumes; Avg. Fee Per Inspection by Property Type reveals pricing variation across property classes; Total Records by City shows geographic demand distribution; Total Inspection Fee by Service Type measures revenue contribution per service category.
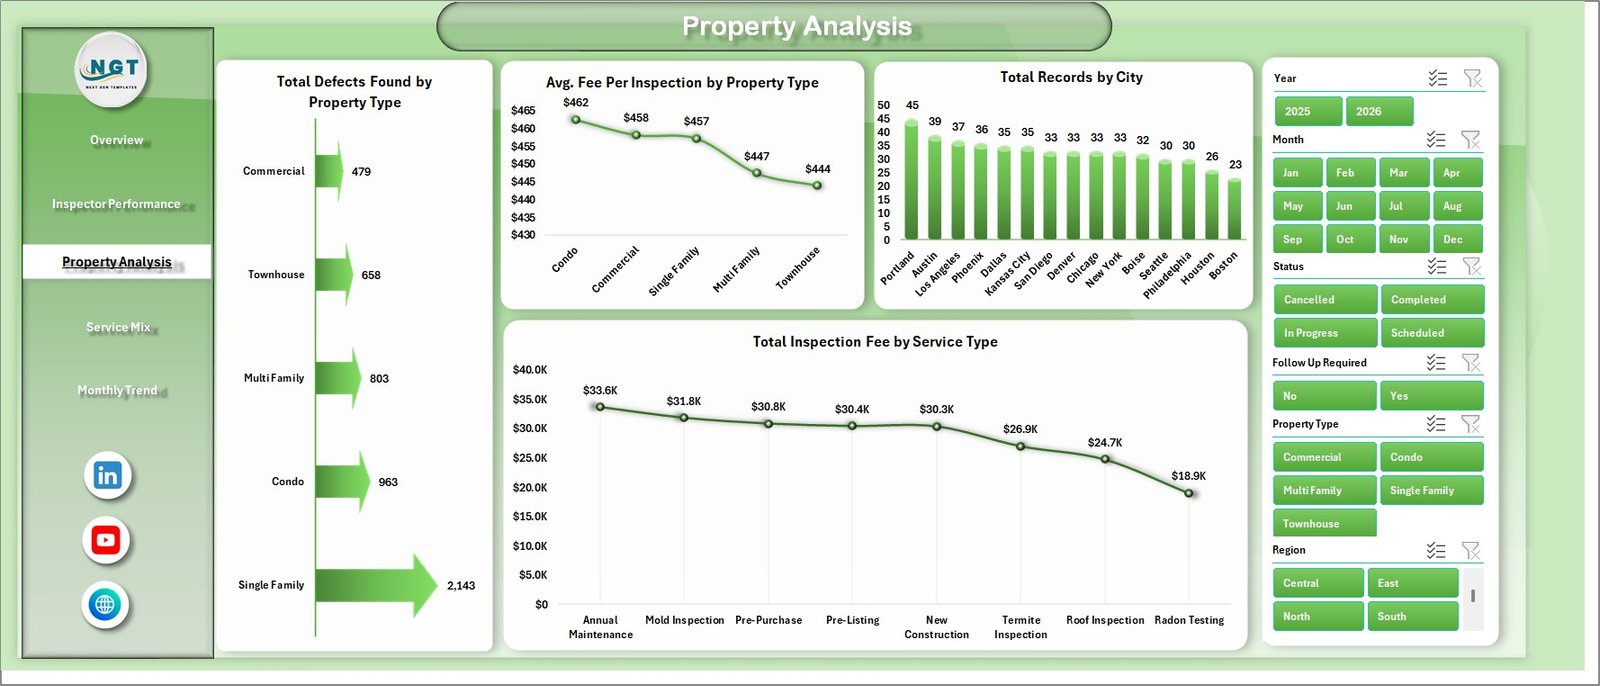
Property Analysis
4. Service Mix Page
Analyzes the service portfolio composition: Total Major Defects by Service Type flags which services surface the most critical findings; Avg. Fee Per Inspection by Service Type shows pricing benchmarks per service; Total Records by Client Type reveals the residential vs. commercial client split; Total Records by Month highlights seasonal booking patterns across the year.
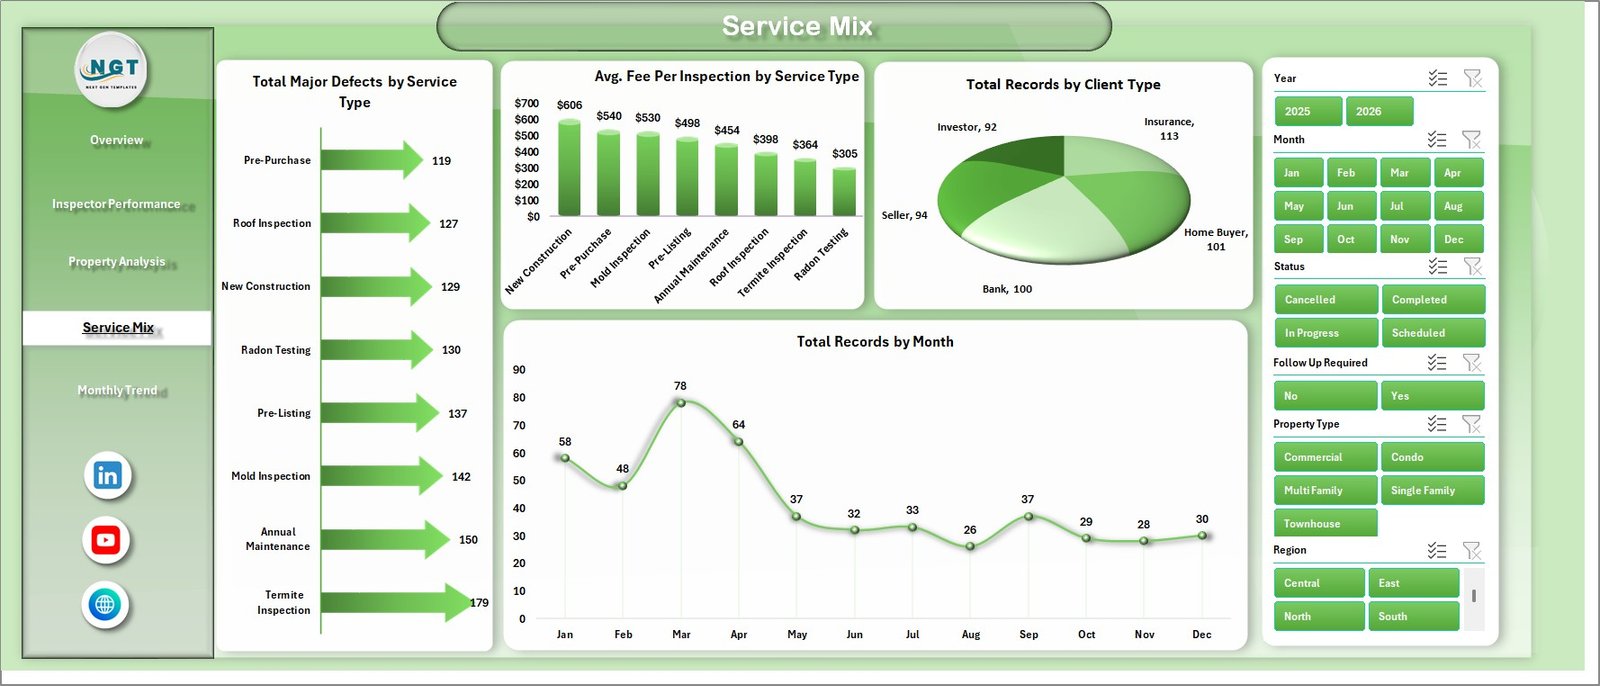
Service Mix
5. Monthly Trend Page
Three charts track performance over time: Net Revenue by Month shows earned revenue trends across the calendar year; Total Inspection Fee by Year enables year-over-year comparison as your dataset grows; Total Records by Status shows volume breakdown across completed, in-progress, and other statuses.
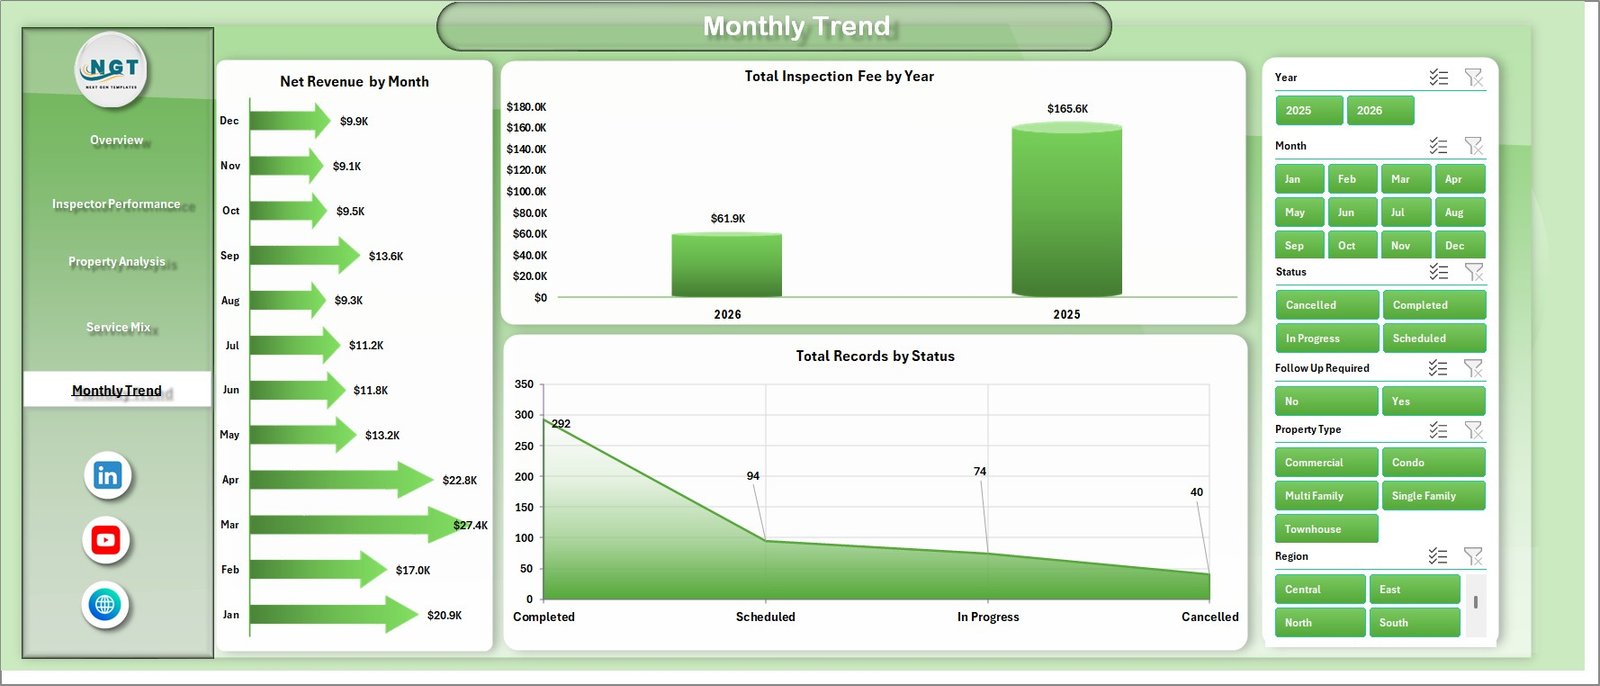
Monthly Trend
6. Data Sheet Tab
The structured data entry sheet where you input your inspection records. Enter data in the same column format as the sample data — the dashboard updates automatically after each Refresh All.
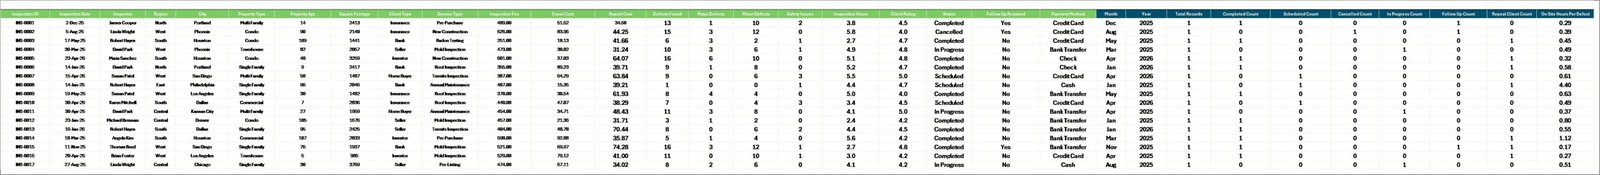
Data Sheet tab
7. Support Sheet
Contains all pivot tables that power the dashboard charts. Go to the Data tab in the Excel Ribbon and click Refresh All after updating the Data sheet. All pivots and charts refresh instantly. This sheet can be hidden after setup.
Support sheet tab
Home Inspection Dashboard in Excel vs. Google Sheets vs. Spectora — Feature Comparison
| Feature | Home Inspection Dashboard in Excel | Google Sheets Dashboard | Spectora / HomeGauge |
|---|---|---|---|
| Cost | $17.99 one-time ✅ | $0 (manual build) | $79–$149/user/month |
| Platform | Microsoft Excel ✅ | Browser-based | Web + mobile app |
| Setup time | Under 10 minutes ✅ | 4–8 hours DIY | 1–3 days onboarding |
| Real-time collaboration | Via OneDrive/SharePoint | Native ✅ | Native ✅ |
| Customizable fields | Fully customizable ✅ | Fully customizable ✅ | Limited |
| Offline access | Yes ✅ | Limited | No |
| Year-1 cost (solo) | $17.99 ✅ | $0 (DIY labor) | $948–$1,788 |
| Inspector performance analysis | Built-in ✅ | Manual setup needed | Basic reports only |
For inspection businesses that want structured analytics without monthly software subscriptions, the Home Inspection Dashboard in Excel is the cost-effective sweet spot.
Who Should Use This Template
Perfect for:
- Home inspection companies managing 2–50 inspectors who need revenue, defect, and performance tracking in one place
- Solo inspectors and freelance inspection professionals wanting professional-grade reporting without monthly fees
- Operations managers in property management or real estate firms tracking inspection service performance
- Real estate investors and landlords monitoring inspection quality and costs across a property portfolio
Not a fit if:
- You need a mobile field app for on-site inspection report writing (this is an analytics dashboard, not a field tool)
- Your team requires live data sync directly from inspection software without manual data entry
- You need automated client communication, scheduling, or invoice generation in the same system
Real-World Use Cases
Marcus runs a 12-inspector home inspection firm. He uses the Inspector Performance page each month to review completion rates and client ratings per team member, identifying top performers for bonuses and flagging inspectors who need coaching. Before this dashboard, he spent 3 hours every month manually compiling spreadsheet reports — now it takes 20 minutes.
Priya is a property management operations lead at a mid-size real estate company. She tracks inspection fees, defect volumes, and service mix across 4 city markets using the Property Analysis and Overview pages, producing a clean leadership report in under 20 minutes of preparation time each quarter.
Tom is a solo certified home inspector who previously tracked everything in a flat spreadsheet. After switching to this dashboard, he now monitors net revenue trends, identifies which service types generate the most revenue per inspection, and uses the Monthly Trend page to project seasonal demand for smarter scheduling and resource planning.
Advantages of Home Inspection Dashboard in Excel
- One-time cost of $17.99 compared to $948–$1,788 per year for Spectora or HomeGauge analytics subscriptions
- No learning curve — if you know how to paste data in Excel and click a button, you can run this dashboard
- Fully offline — works without internet, VPN, or cloud access, which matters for inspectors in low-connectivity areas
- Pivot-driven flexibility — add new data columns or create additional pivot charts without breaking the existing structure
- Shareable — email the file to stakeholders, upload to SharePoint, or share via OneDrive with no per-user licensing restrictions
Opportunities for Improvement
- Data entry is manual — teams using inspection management software will need to export data as CSV and paste it into the Data sheet rather than having automatic sync
- The dashboard is designed for a single workbook — very large datasets (10,000+ records) may benefit from Power Query for data loading and transformation
- Mobile editing is limited — while the dashboard is viewable on Excel mobile, slicer interactions work best on desktop
Best Practices
- Keep the Data sheet columns intact — only add new columns to the right to avoid breaking pivot references
- Click Refresh All (Data ribbon) every time you add or update records before reviewing dashboard charts
- Hide the Support sheet once setup is complete to prevent accidental edits to the pivot tables
- Back up the workbook monthly by saving a dated copy — e.g., “Home-Inspection-Dashboard-May-2026.xlsx”
- If you add a new year of data, verify that the year slicer on the Overview page includes it — slicer values update on Refresh All
Explore Relevant Templates
Looking for more property analytics tools? Explore the Property Management Dashboard in Google Sheets for browser-based collaboration, or the Real Estate Property Tracker in Google Sheets for portfolio-level property monitoring. You can also read the companion blog post for Property Management Dashboard in Excel and explore the broader Excel Dashboard tutorials on this blog.
Frequently Asked Questions
What KPIs does the Home Inspection Dashboard in Excel track?
The Home Inspection Dashboard in Excel tracks 5 KPI summary cards — Total Inspection Fee, Total Records, Total Defects Found, Net Revenue, and Avg. Client Rating — plus 16 charts covering revenue, inspector performance, property defects, service mix, and monthly trends. All metrics update automatically when you click Refresh All after updating the Data sheet.
How many pages does the Home Inspection Dashboard have?
The dashboard includes 5 analysis pages (Overview, Inspector Performance, Property Analysis, Service Mix, Monthly Trend), 1 Data sheet, and 1 Support sheet — 7 sheets total. The Support sheet can be hidden once setup is complete to keep the workbook tidy.
Do I need VBA or macros to use this dashboard?
No. The Home Inspection Dashboard in Excel is built entirely with standard pivot tables, pivot charts, and slicers. No macros or VBA code are required. It works in Excel 2016 and later, including all Microsoft 365 versions on Windows and Mac.
How does this compare to Spectora or HomeGauge?
Spectora and HomeGauge are field inspection apps costing $79–$149/month per user with mobile reporting and automated client features. The Home Inspection Dashboard in Excel is an offline analytics tool for $17.99 one-time — ideal for teams that manage data separately and need structured performance reporting without a recurring subscription.
Can I add new columns to the Data sheet for custom fields?
Yes. You can add new columns to the right of the existing data columns and build new pivot fields from them in the Support sheet. The Home Inspection Dashboard in Excel is fully customizable — you own the file and can modify pivot tables, add charts, or adjust the layout to match your workflow.
How long does setup take?
Under 10 minutes. Download and unzip the file, open it in Excel, paste your existing inspection records into the Data sheet following the sample format, then click Data → Refresh All. All 5 dashboard pages populate automatically with your data.
About the Author
Built by PK — Microsoft Certified Professional with 15+ years of Excel, Google Sheets, and Power BI experience. Founder of NextGenTemplates, reaching 300K+ subscribers across YouTube channels. Every template is hand-built and tested before release.
Conclusion
If you manage a home inspection business or track inspection performance across a team, the Home Inspection Dashboard in Excel gives you a complete analytics layer — 5 analysis pages, 16 charts, 5 KPI cards, and dynamic slicers — in a one-time $17.99 Excel file with no subscriptions and no per-user fees.
👉 Click here to Purchase the Home Inspection Dashboard in Excel
✅ Instant download · One-time payment · No subscription
For more Excel dashboard tutorials, visit Youtube.com/@PK-AnExcelExpert
📅 Last updated: May 2026