Packaging facilities lose an estimated 5–15% of production capacity every year to unplanned machine downtime — yet most maintenance teams are still logging events in spreadsheets with no way to visualize patterns, compare plants, or track repair costs over time. The Packaging Machine Downtime Dashboard in Power BI changes that: it tracks 5 KPIs across 5 dedicated report pages with 12 pre-built charts, giving maintenance managers and plant engineers a complete picture of equipment performance in a single .pbix file.
In this post, we walk through every page of the dashboard, explain the charts and KPIs included, and show you how manufacturing teams are using it to reduce MTTR, cut repair costs, and finally connect machine health data to production output. You can click here to purchase the Packaging Machine Downtime Dashboard in Power BI for a one-time fee of $17.99 — no subscription, no per-user fees, lifetime access.
👉 Click here to Purchase the Packaging Machine Downtime Dashboard in Power BI
What Is the Packaging Machine Downtime Dashboard in Power BI?
The Packaging Machine Downtime Dashboard in Power BI is a ready-built .pbix report template designed for packaging and manufacturing operations teams. It provides structured, interactive analysis of machine downtime events — covering downtime hours, repair costs, availability, performance, and production output — across five focused report pages. Every chart, KPI card, and slicer is pre-configured; you simply replace the sample data with your own records and the entire dashboard refreshes automatically.
Unlike generic BI templates, this dashboard is purpose-built for the metrics that matter in packaging operations: MTTR (Mean Time to Repair), Availability %, Performance %, Downtime by Category, and Repair Cost by Plant. It works with the free version of Power BI Desktop — no paid Microsoft license required for local use.
Key Features of the Packaging Machine Downtime Dashboard in Power BI
The Packaging Machine Downtime Dashboard in Power BI includes the following features that make it immediately useful for maintenance and operations teams:
It tracks 5 core KPIs on the Overview page: Total Events, Total Downtime Hours, Total Repair Cost, Total Units Produced, and Avg MTTR Hours. These five metrics give management-level visibility into equipment health without requiring any DAX knowledge.
Twelve pre-built charts cover every angle of machine downtime: cost by month, availability by plant, quality by priority, downtime by category, machine performance by type, production output by line, and more. Every chart is interactive — slicers on each page filter the entire view dynamically by Plant, Machine Type, Downtime Category, Priority, and Date.
The template is fully customizable. You can rename machine types, add new plants, change priority codes, and extend the data table with additional fields. The .pbix source file is open and editable in Power BI Desktop without any restrictions.
👉 Click here to Purchase the Packaging Machine Downtime Dashboard in Power BI
Dashboard Pages Explanation
Page 1 — Overview
The Overview page is the executive summary of your packaging operation’s machine health. At the top, five KPI cards display the headline numbers: Total Events, Total Downtime Hours, Total Repair Cost, Total Units Produced, and Avg MTTR Hours. These cards respond to all slicers on the page, so managers can instantly filter to a specific plant or time period and see the numbers change in real time.
Below the cards, four charts provide trend and distribution context: Total Repair Cost by Month Name shows cost trends over time for budget planning; Availability % by Overall gives a facility-level availability benchmark; Quality % by Priority breaks down quality performance by maintenance priority level; and Total Downtime Hours by Plant compares downtime volume across facilities.
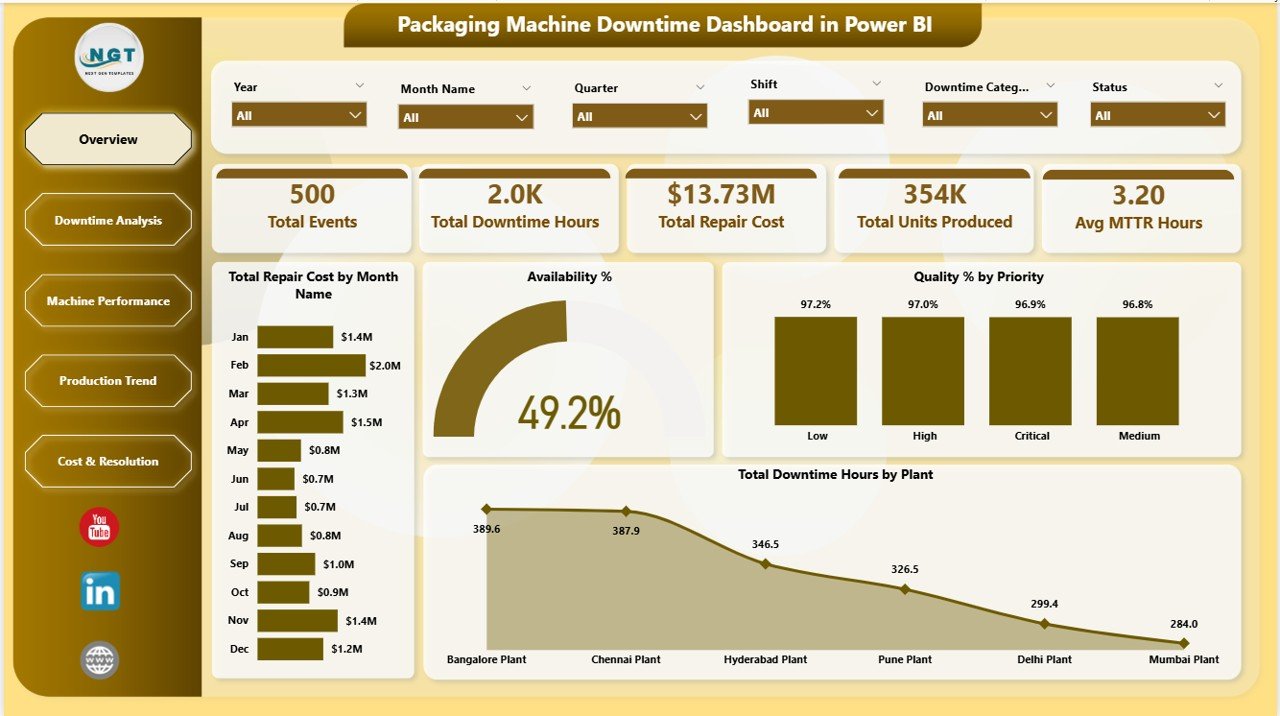
Packaging Machine Downtime Dashboard in Power BI – Overview Page
Page 2 — Downtime Analysis
The Downtime Analysis page is where root-cause work happens. Total Repair Cost by Priority helps teams understand whether critical, major, or minor events are driving the most budget spend. Total Downtime Hours by Top Five Downtime Reason surfaces the five most frequent or impactful failure causes — the 80/20 insight maintenance managers need to justify preventive maintenance investments. Total Downtime Hours and Total Events by Downtime Category shows whether mechanical failures, electrical faults, human errors, or scheduled maintenance are the dominant contributors to lost production time.
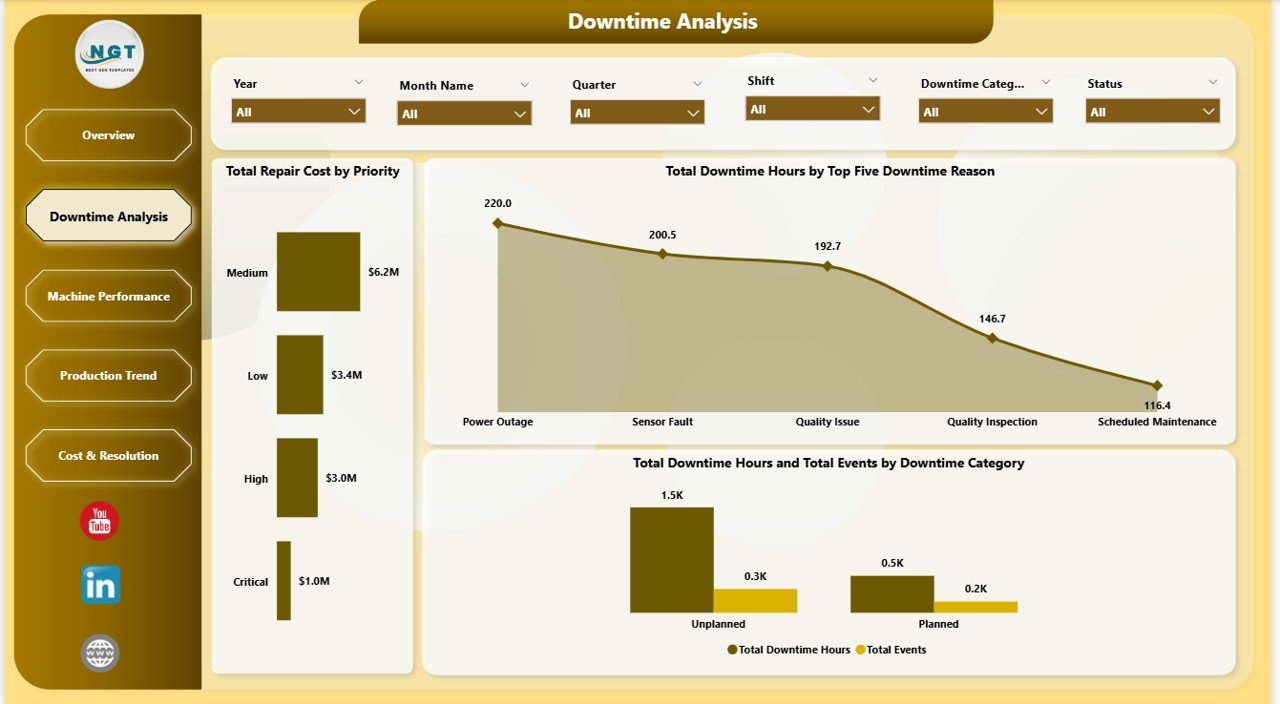
Packaging Machine Downtime Dashboard in Power BI – Downtime Analysis
Page 3 — Machine Performance
The Machine Performance page connects asset-level data to operational outcomes. Availability % by Machine Type identifies which equipment categories (fillers, sealers, labelers, conveyors, etc.) are consistently below availability targets. Performance % by Plant compares how different facilities are performing against their rated output capacity. Total Repair Cost by Machine Type highlights the equipment categories consuming the most maintenance budget, providing data-driven input for capital replacement decisions.
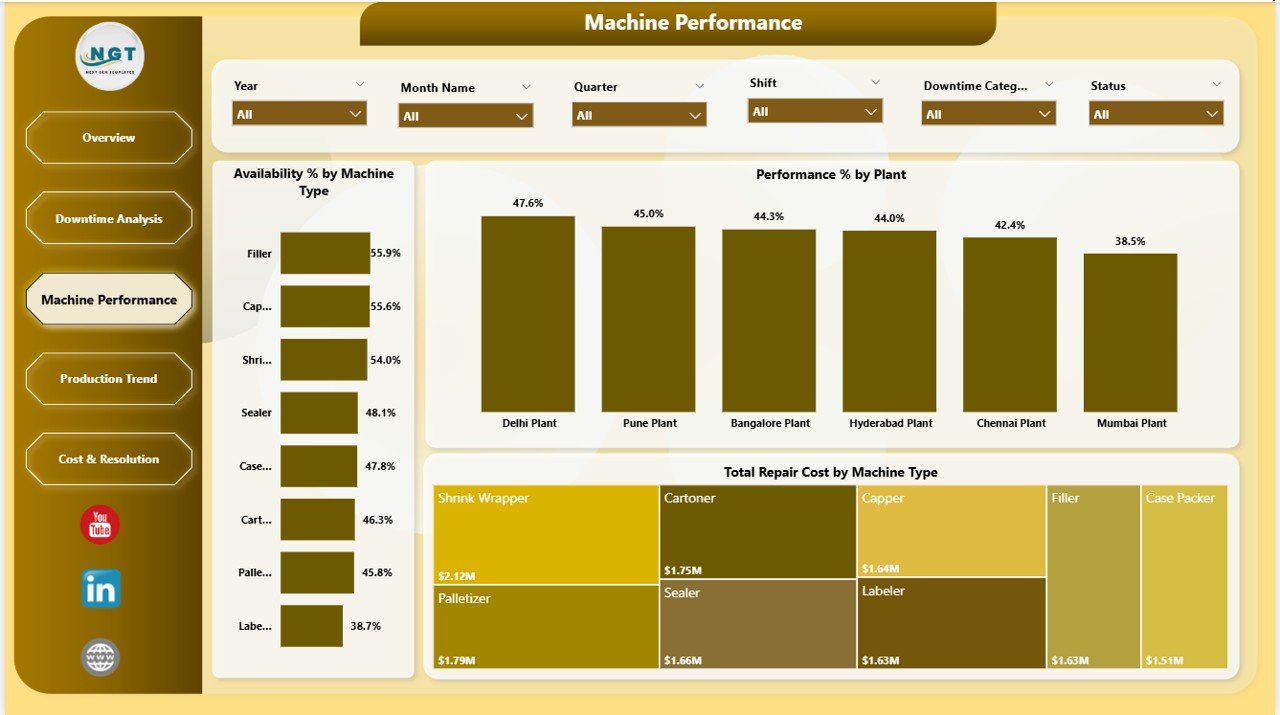
Packaging Machine Downtime Dashboard in Power BI – Machine Performance
Page 4 — Production Trend
The Production Trend page is the bridge between maintenance data and production outcomes. Availability % and Performance % by Production Line lets operations teams see which lines are running efficiently and which are dragging overall OEE scores. Total Downtime Hours by Priority shows whether high-priority events are being resolved faster over time. Total Units Produced by Month Name plots output volumes month-by-month, making it easy to correlate spikes in downtime hours with dips in production output.
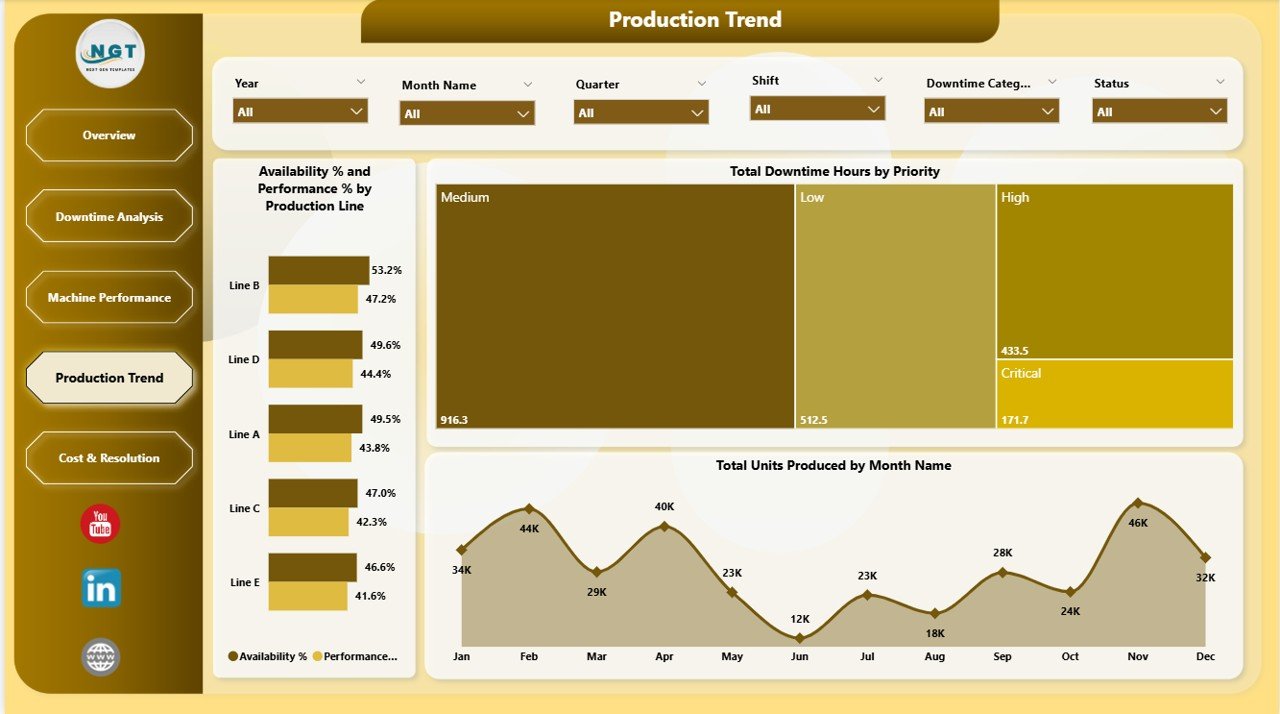
Packaging Machine Downtime Dashboard in Power BI – Production Trend
Page 5 — Cost and Resolution
The Cost and Resolution page answers the financial and operational closure questions. Total Repair Cost by Plant compares maintenance spend across facilities. Total Repair Cost by Production Line drills down to line-level cost analysis. Total Events by Status breaks down all maintenance tickets into Open, Resolved, and Pending categories — giving maintenance managers a live backlog view.
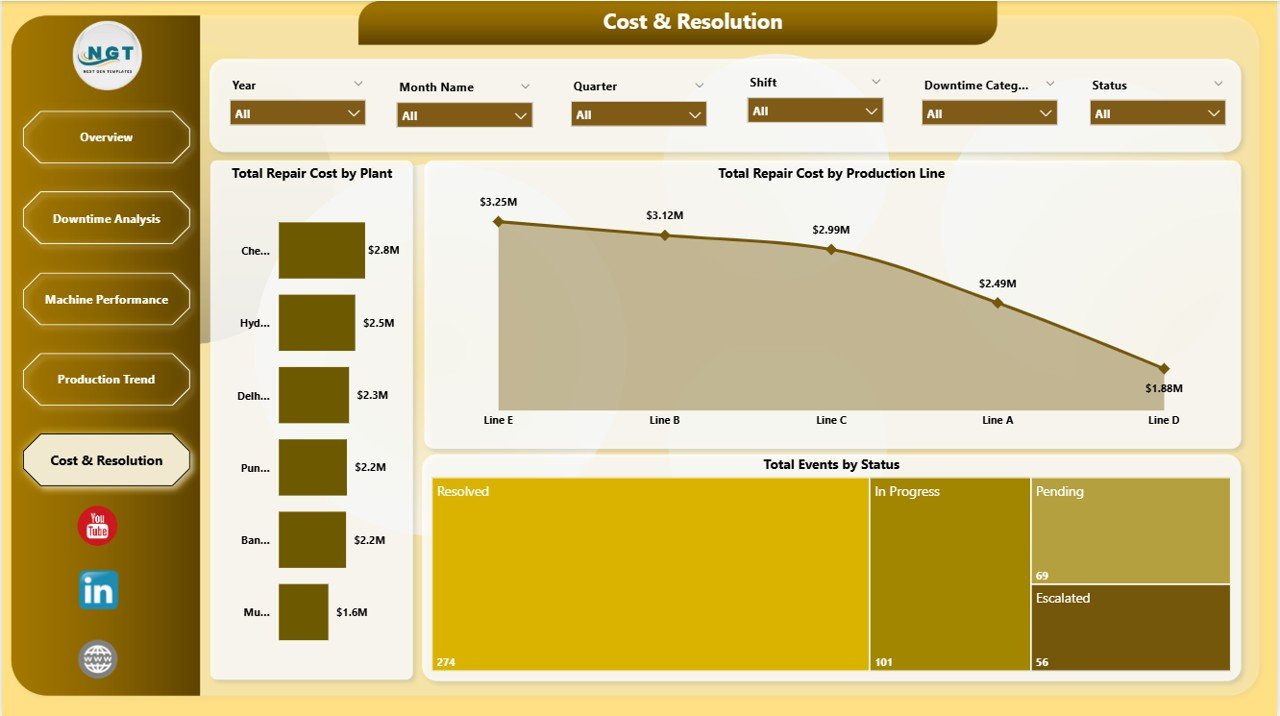
Packaging Machine Downtime Dashboard in Power BI – Cost and Resolution
Packaging Machine Downtime Dashboard in Power BI vs. Tableau vs. Paid CMMS
| Feature | Packaging Machine Downtime Dashboard in Power BI | Tableau Dashboard | CMMS / MaintainX |
|---|---|---|---|
| Cost | $17.99 one-time | $15-75/user/month | $16-115/user/month |
| Platform | Power BI Desktop (free) | Tableau Desktop (paid) | Web/mobile app |
| Setup Time | Under 10 minutes | Hours of configuration | Days of onboarding |
| Offline Access | Yes | Requires Tableau Server | Requires internet |
| Customizable Fields | Fully customizable .pbix | Limited without paid license | Plan-dependent |
| Downtime Root-Cause Charts | Built-in, 5 pages | Build from scratch | Basic reports only |
| MTTR Tracking | KPI card included | Custom build required | Paid tier only |
| Year-1 Cost (5 users) | $17.99 total | $4,500+ | $960-$6,900 |
For packaging and manufacturing teams that need professional downtime analytics without CMMS subscription costs, the Packaging Machine Downtime Dashboard in Power BI sits in the sweet spot.
Who Should Use This Template
Perfect for:
- Maintenance managers tracking equipment downtime across packaging lines
- Plant engineers who need MTTR and availability metrics in a visual Power BI format
- Operations analysts presenting repair cost trends monthly to management
- Manufacturing teams already using Power BI who want a purpose-built downtime template
- Mid-size packaging facilities without a dedicated CMMS system
Not a fit if:
- You need real-time machine sensor integration or IoT middleware
- Your enterprise requires SOC 2 compliance or automated work-order generation
- You are not using Power BI Desktop (free download required from Microsoft)
Real-World Use Cases
Ravi manages maintenance for a 4-line food packaging facility. He uses the Packaging Machine Downtime Dashboard in Power BI every Monday morning to review last week’s downtime hours by plant and identify which machines triggered the most repair events. His MTTR dropped 18% after he identified that one filler machine accounted for 40% of total downtime hours.
Elena is a production analyst at a pharma packaging company. She tracks Availability % and Performance % by Production Line to build quarterly capacity reports. The Production Trend page lets her cross-reference downtime spikes against low unit-production months — giving her hard numbers for capital equipment justification requests.
A beverage packaging operation with three plants replaced its manual Excel downtime log with this template. The Cost and Resolution page now gives their operations director a weekly snapshot of open vs. resolved maintenance tickets in seconds.
Advantages of the Packaging Machine Downtime Dashboard in Power BI
The most immediate advantage is time savings. Building these five report pages from scratch in Power BI typically takes 20-40 hours of DAX work and report design. At $17.99, you get a production-ready template that installs in 10 minutes.
The second major advantage is insight depth. Root-cause breakdowns by Downtime Category and Top 5 Reason, cost comparisons by Plant and Production Line, and Availability %/Performance % metrics that feed directly into OEE calculations — this level of analysis changes how maintenance reviews get run.
Third, it is a one-time cost of $17.99 vs. $16-115 per user per month for comparable CMMS reporting modules. For an authoritative guide on connecting industrial data, see the Microsoft Power BI documentation.
Opportunities for Improvement
The dashboard requires manual data input or periodic refresh — it does not automatically pull from PLCs, SCADA systems, or IoT sensors. It also does not include a work-order management module; event status (Open, Resolved, Pending) is a reporting field only, not a ticket-routing system.
Best Practices
Maintain a consistent downtime event log with these fields: Machine Name, Machine Type, Plant, Production Line, Downtime Date, Downtime Hours, Repair Cost, Downtime Category, Downtime Reason, Priority, and Status. Run a weekly data refresh on Monday mornings, use the Downtime Analysis page monthly for root-cause reviews, and use Production Trend quarterly for capacity planning.
Explore Relevant Templates
- Packaging Machine Downtime Dashboard in Excel — Excel-based version for teams not on Power BI
- Automation Units Dashboard in Power BI — Track automation line performance in Power BI
- Manufacturing Dashboard in HTML — Browser-based manufacturing analytics, no software needed
Get all 8 manufacturing templates in the Manufacturing Excellence Bundle.
Also see: Packaging Machine Downtime Dashboard in Excel tutorial | Automation Units Dashboard in Power BI walkthrough
Frequently Asked Questions
What KPIs does the Packaging Machine Downtime Dashboard in Power BI track?
The Packaging Machine Downtime Dashboard in Power BI tracks 5 KPIs: Total Events, Total Downtime Hours, Total Repair Cost, Total Units Produced, and Avg MTTR Hours. All metrics update automatically when you replace the sample data in Power BI Desktop.
Do I need a paid Power BI license to use this template?
No. The Packaging Machine Downtime Dashboard in Power BI works with Power BI Desktop, which is a free download from Microsoft. A paid license is only needed to publish to Power BI Service for online team sharing.
Can I customize the charts and slicers in this template?
Yes. The .pbix file is fully editable in Power BI Desktop. You can add pages, rename fields, change the color theme, and adjust slicer values — no advanced DAX knowledge required for basic customization.
How does this compare to a CMMS like MaintainX or UpKeep?
The Packaging Machine Downtime Dashboard in Power BI is a reporting template at $17.99 one-time vs. $16-115/user/month for CMMS platforms. It excels at historical downtime pattern analysis; CMMS tools are better for real-time work-order routing.
What downtime metrics are on the Downtime Analysis page?
The Downtime Analysis page covers Total Repair Cost by Priority, Total Downtime Hours by the Top Five Downtime Reasons, and Total Downtime Hours and Total Events by Downtime Category — helping teams identify recurring failure patterns driving the most cost.
Is an Excel version of this dashboard available?
Yes. The Packaging Machine Downtime Dashboard in Excel is available separately. Both versions track the same five KPIs with platform-specific visualizations.
How long does setup take?
Most users have the Packaging Machine Downtime Dashboard in Power BI running with their own data in under 10 minutes. Open the .pbix file, replace the sample data, click Refresh, and all 12 charts and 5 KPI cards update automatically.
About the Author
Built by PK — Microsoft Certified Professional with 15+ years of Excel, Google Sheets, and Power BI experience. Founder of NextGenTemplates, reaching 300K+ subscribers across YouTube channels. Every template is hand-built and tested before release. Follow for weekly Power BI tutorials: Youtube.com/@PK-AnExcelExpert
Conclusion
The Packaging Machine Downtime Dashboard in Power BI gives maintenance managers, plant engineers, and operations teams a complete view of equipment downtime, repair costs, machine availability, and production output across five purpose-built report pages — ready in under 10 minutes at $17.99 one-time.
👉 Click here to Purchase the Packaging Machine Downtime Dashboard in Power BI
Instant download · One-time payment · No subscription · Lifetime access
Last updated: May 2026