The Influencer Campaign Dashboard in Power BI tracks 5 high-level KPIs and 16 pre-built visuals across 5 interactive report pages — Overview, Platform Analysis, Niche Insights, Influencer Performance, and Trend Analysis. Setup takes under 10 minutes: open the .pbix file in the free Power BI Desktop app, connect your campaign data, and every chart, KPI card, and slicer refreshes automatically.
Influencer marketing budgets keep climbing, yet most brand teams still report on campaigns from messy spreadsheets and slide decks pieced together every month. The Influencer Campaign Dashboard in Power BI solves that problem at a one-time cost of $17.99 — the same KPI structure marketing leaders defend in board meetings, packaged in a .pbix file you can edit, share, and re-skin to match your brand. It runs on Microsoft’s free Power BI Desktop, so there is no monthly SaaS bill and no per-user license required for local use.
🛍️ Click here to Purchase the Influencer Campaign Dashboard in Power BI
Influencer Campaign Dashboard in Power BI
Key Features of the Influencer Campaign Dashboard in Power BI
Every page is filterable through Power BI slicers, and every visual is wired to a single data model you can extend with new metric columns at any time.
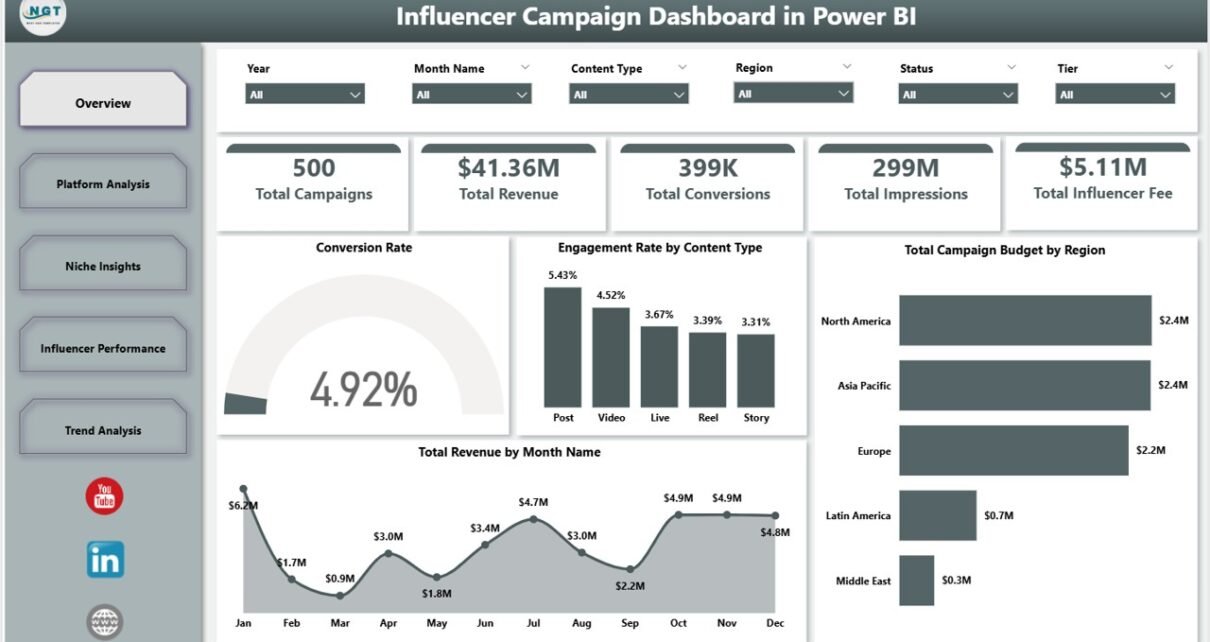
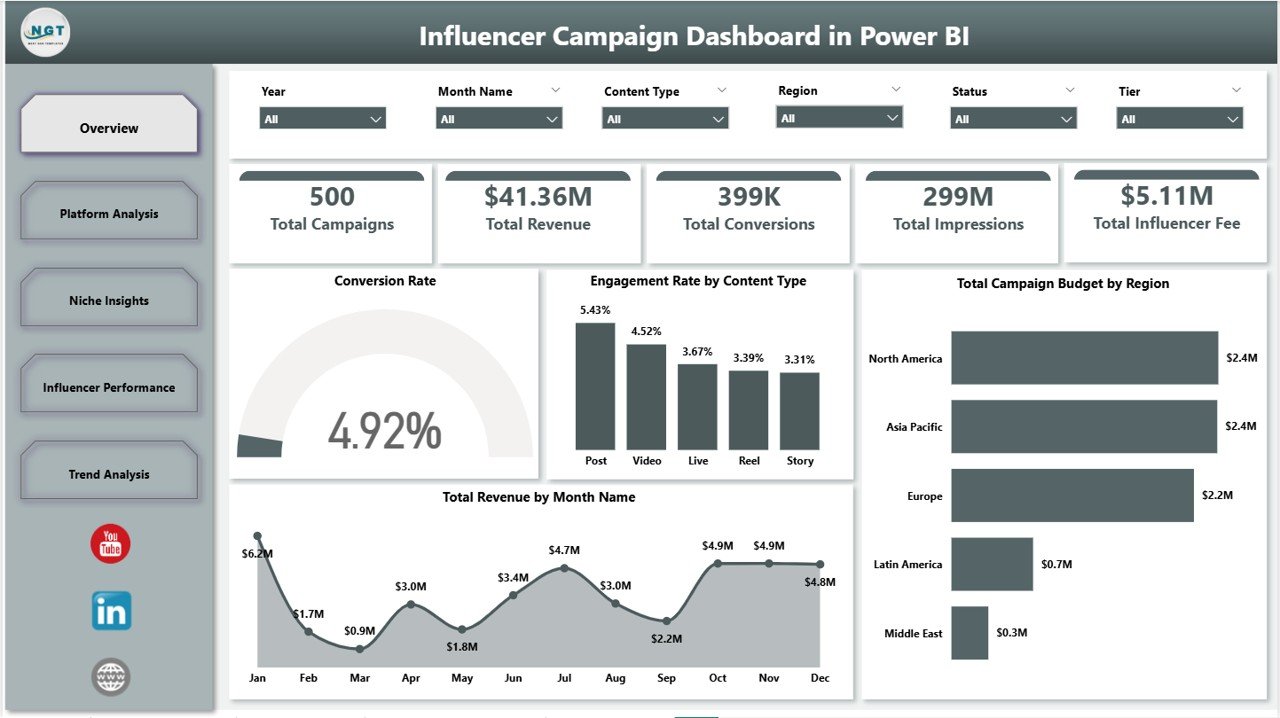
- 5 KPI cards on the Overview page — Total Campaigns, Total Revenue, Total Conversions, Total Impressions, and Total Influencer Fee — give a single-glance health check before you drill into any chart.
- 5 interactive report pages covering Overview, Platform Analysis, Niche Insights, Influencer Performance, and Trend Analysis. Each page has its own slicer set for platform, region, tier, niche, content type, and status.
- 16 pre-built visuals including Engagement Rate by Content Type, Conversion Rate by Platform, Total Revenue by Niche, ROI by Niche, Total Revenue by Tier, and Top Five Influencers by Revenue.
- Top Five Influencer benchmarking ranks creators by total revenue and engagement rate so contract-renewal calls become obvious instead of debatable.
- Niche, region, and tier breakdowns reveal which verticals, geographies, and influencer tiers (nano, micro, mid, macro, mega) deliver the highest revenue and conversion volume per dollar of influencer fee.
- Fully editable — add new DAX measures, swap brand colors, rename KPI cards, or extend the data model with your own metric columns. The .pbix is yours to modify forever.
- Free Power BI Desktop compatible — no Power BI Pro license required to build or view locally.
Dashboard Pages Explanation
The .pbix file ships with five interactive report pages. Power BI dashboards do not include separate Data, Search, or Support sheets the way Excel and Google Sheets dashboards do — the data model is connected directly to your source.
1. Overview Page
Five KPI cards sit at the top: Total Campaigns, Total Revenue, Total Conversions, Total Impressions, and Total Influencer Fee. Below them, four visuals — Conversion Rate, Engagement Rate by Content Type, Total Campaign Budget by Region, and Total Revenue by Month Name — paint the executive summary in seconds. Multiple slicers above the visuals let you scope the entire page by platform, region, tier, niche, or status.
2. Platform Analysis
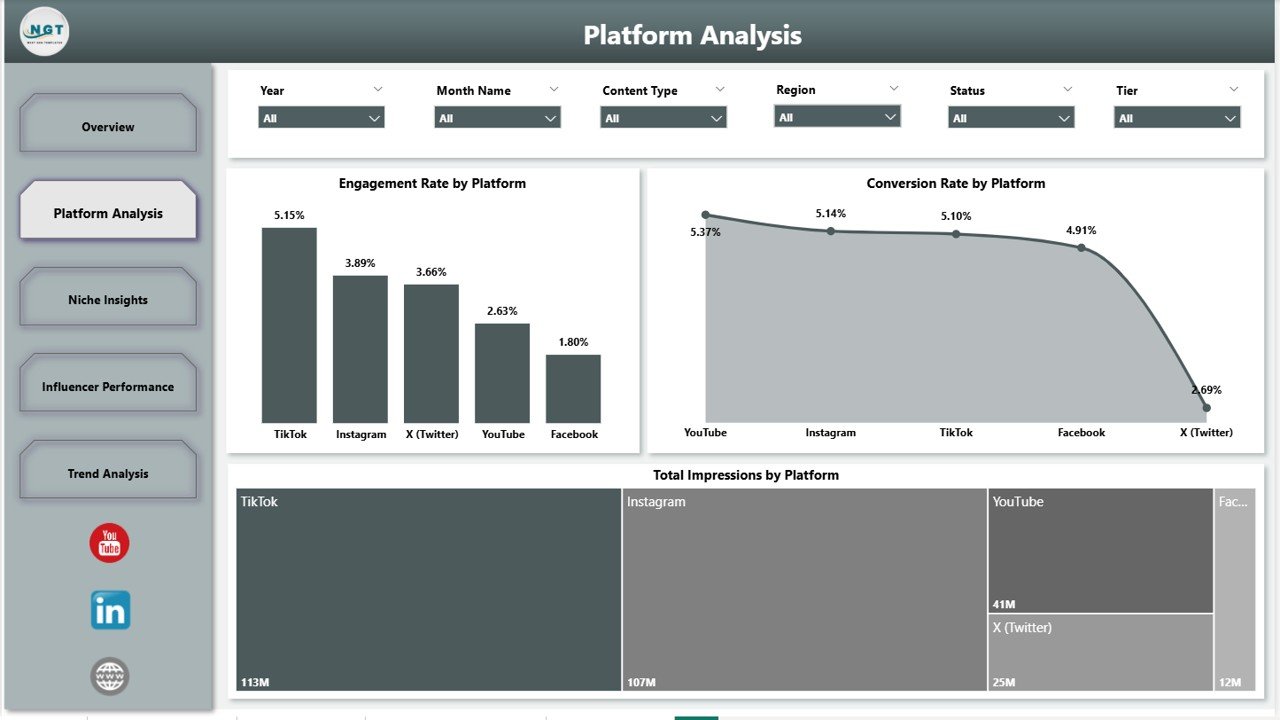
Platform Analysis
Three platform-focused visuals: Engagement Rate by Platform, Conversion Rate by Platform, and Total Impressions by Platform. The pattern most brand teams discover here is critical — platforms with the highest reach often have the lowest conversion rates. This page surfaces that gap in seconds, which then drives the next quarter’s budget allocation between Instagram, TikTok, YouTube, and the rest.
3. Niche Insights
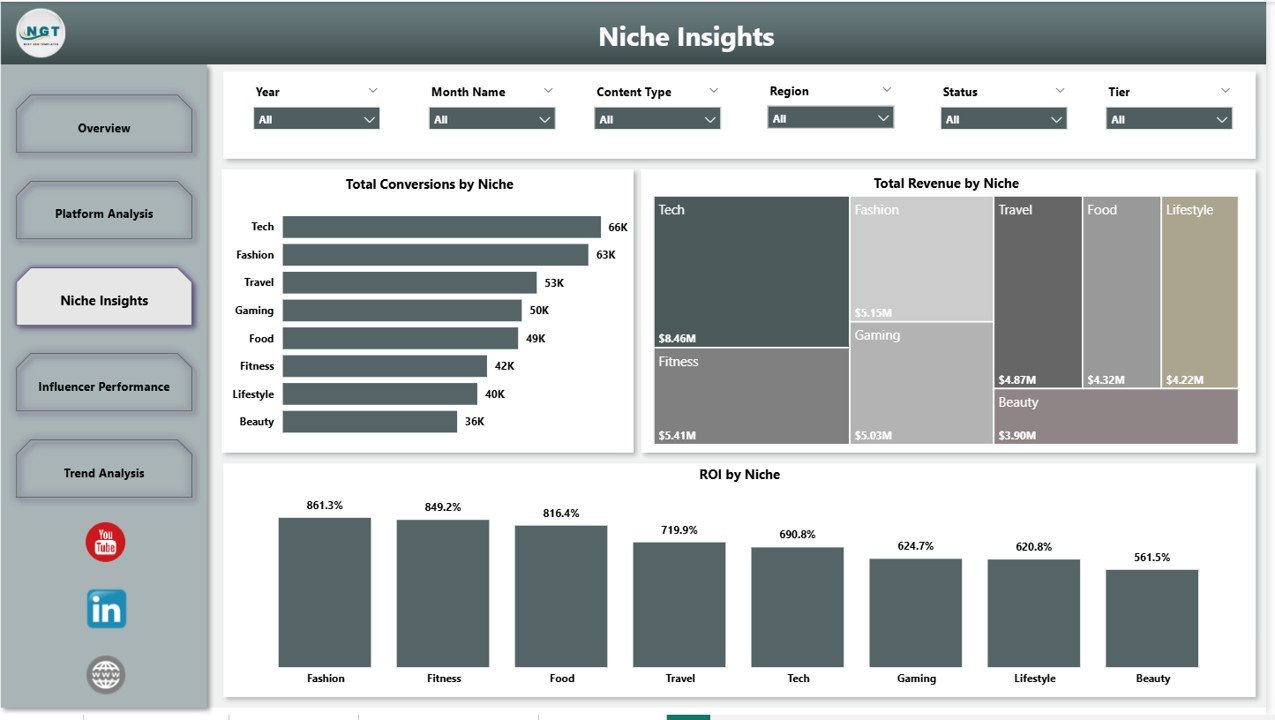
Niche Insights
Three niche-level visuals: Total Conversions by Niche, Total Revenue by Niche, and ROI by Niche. Whether your brand spans beauty, fitness, fintech, gaming, or family content, this page tells you which verticals deliver the highest revenue per dollar spent on influencer fees — the data point that justifies (or kills) niche expansion.
4. Influencer Performance
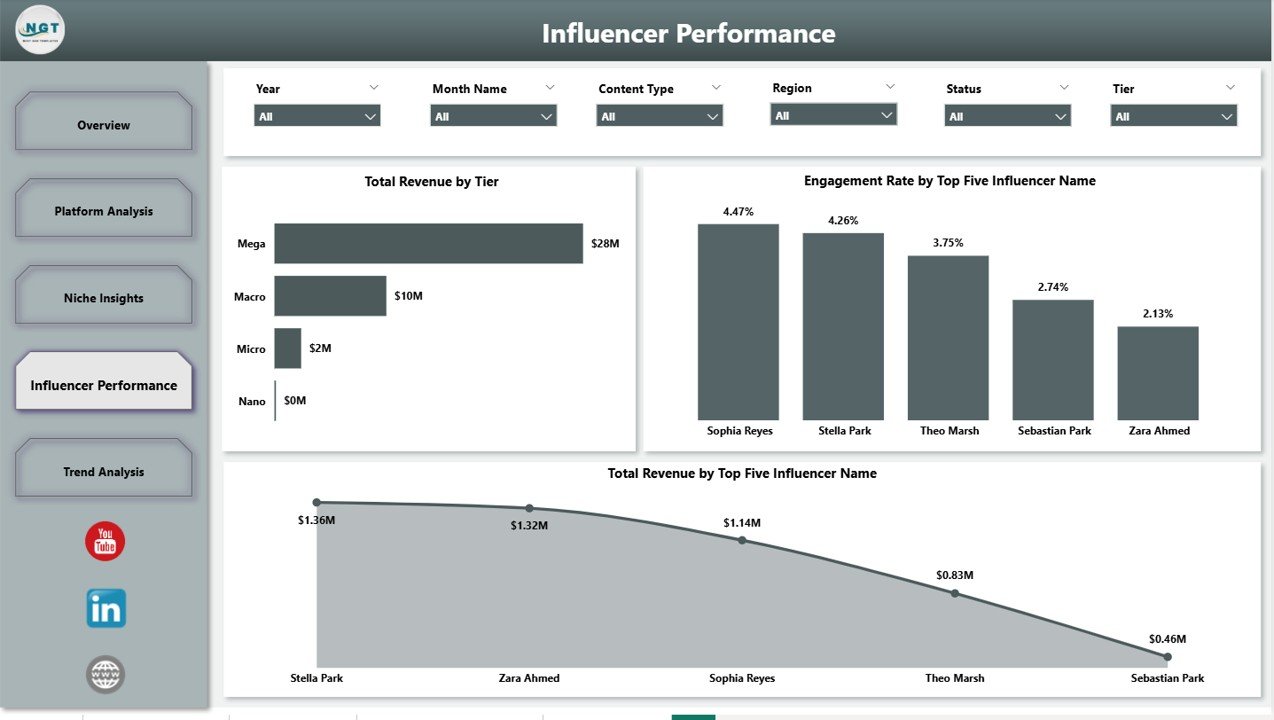
Influencer Performance
Three creator-focused visuals: Total Revenue by Tier, Engagement Rate by Top Five Influencer Name, and Total Revenue by Top Five Influencer Name. The Top Five Influencer breakdowns make contract-renewal decisions almost mechanical — the creators who actually move revenue stand out, and the ones who don’t are just as visible.
5. Trend Analysis
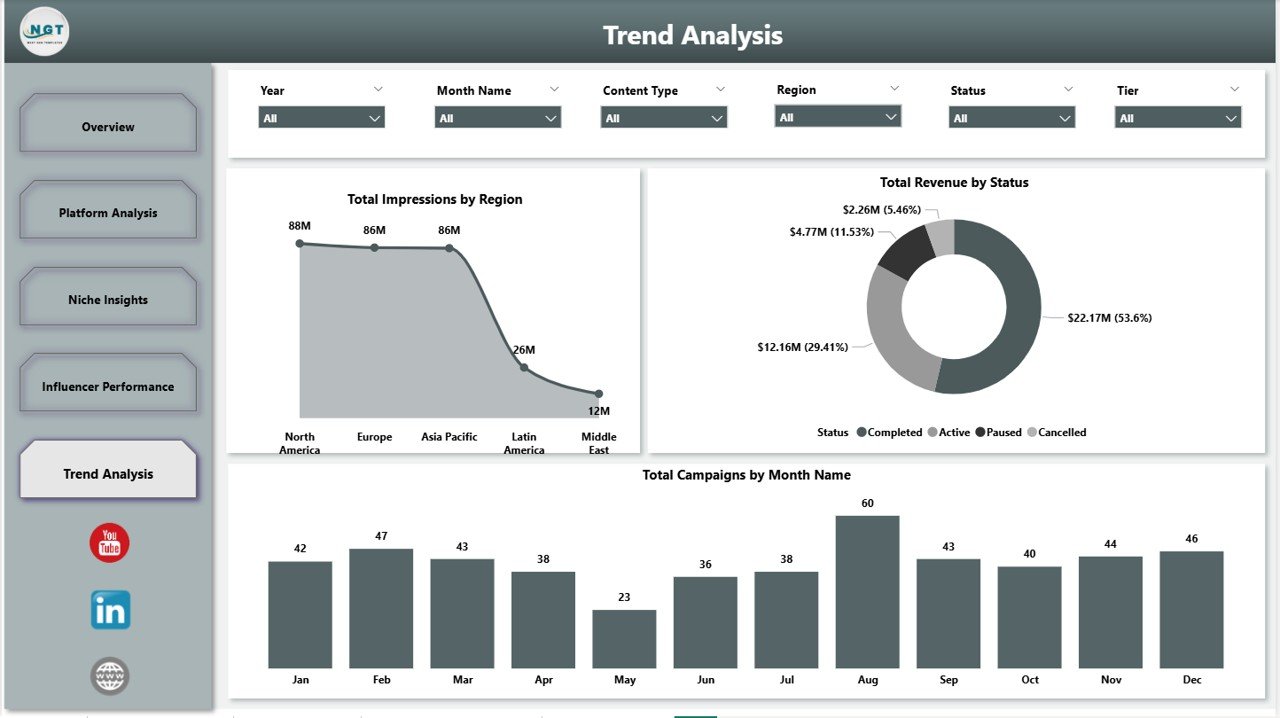
Trend Analysis
Three trend visuals: Total Impressions by Region, Total Revenue by Status, and Total Campaigns by Month Name. Use this page in monthly business reviews to spot seasonality patterns early, forecast next-quarter spend more accurately, and track how completed-versus-active campaigns are pacing against plan.
Influencer Campaign Dashboard in Power BI vs. Tableau / Qlik vs. Aspire / GRIN / Modash — Feature Comparison
| Feature | Influencer Campaign Dashboard in Power BI | Tableau / Qlik Sense | Aspire / GRIN / Modash |
|---|---|---|---|
| Cost | $17.99 one-time | $70–$115 / user / month | $200–1000+ / month |
| Platform | Power BI Desktop (free) | Requires paid license | Cloud SaaS |
| Setup time | Under 10 minutes | Days to weeks | 1–3 weeks (CSM-led) |
| Influencer-specific KPIs | ✅ 5 cards + 16 visuals | Build from scratch | ✅ Included |
| Tier & niche analysis | ✅ Built-in pages | Manual build required | ✅ Partial |
| Customizable visuals | ✅ Full Power BI access | ✅ Yes | ⚠️ Vendor-locked |
| No subscription | ✅ One-time | ❌ Monthly required | ❌ Annual contract |
| Year-1 cost (5 users) | $17.99 total | $4,200–$6,900 | $2,400–$60,000+ |
For brand and agency teams that want enterprise-grade campaign analytics without the enterprise price tag, the Influencer Campaign Dashboard in Power BI sits in the sweet spot.
Who Should Use This Template
Perfect for:
- In-house brand marketers running 5–200 influencer campaigns per quarter who need a single ROI view.
- Boutique influencer agencies delivering monthly client reports without paying for enterprise SaaS.
- DTC and e-commerce teams already standardizing on Power BI for marketing analytics.
- Solo founders and consultants priced out of $200+/month influencer marketing platforms.
Not a fit if:
- You need automatic creator discovery, outreach, or contract signing — those are SaaS-only features.
- Your team refuses to open Power BI Desktop or learn basic data connections.
- You require real-time API integrations with TikTok, Instagram, or YouTube data feeds.
Real-World Use Cases
Mia runs influencer marketing at a 40-person beauty DTC brand. Every Friday she pulls campaign data from her creator platform export and Shopify revenue feed, refreshes the .pbix, and presents the Overview page in the Monday standup — saving her team $600 per month in SaaS fees and locking down a single source of truth for ROI across her entire creator program.
Daniel manages a boutique influencer agency with eight brand clients. He duplicates the dashboard for each client, plugs in their campaign data, and ships a monthly Power BI report. What used to take half a day in PowerPoint now takes 45 minutes, and the Influencer Performance page makes the contract-renewal conversation almost self-evident.
Priya is a solo SaaS founder running her first 12 creator partnerships. Instead of paying $300 per month for a dedicated SaaS tool, she paid $17.99 once and uses the Tier and Niche pages to figure out where to invest her next $10K in influencer spend.
🛍️ Click here to Purchase the Influencer Campaign Dashboard in Power BI
Advantages of the Influencer Campaign Dashboard in Power BI
- Replaces $200+/month SaaS with a one-time $17.99 purchase — saving small marketing teams thousands of dollars per year.
- Built on Microsoft’s Power BI standard, so your reports look credible to any executive or client used to Microsoft tooling.
- Full data ownership — your campaign data stays in your environment, not in a vendor cloud.
- Pivot-style data model means adding new metric columns to source data does not break existing visuals.
- Lifetime access — use it on as many client engagements or campaigns as you like.
Opportunities for Improvement
Honest limitations worth knowing:
- This is a manual-data dashboard. It does not auto-pull data from Instagram, TikTok, or YouTube APIs — you (or your data engineer) refresh the data source on a cadence.
- Real-time multi-user editing requires Power BI Service (Pro license, ~$10/user/month). Local use on Power BI Desktop remains free.
- If you are running fewer than 5 campaigns total per year, a simple Excel sheet may be enough — the dashboard’s value compounds with campaign volume.
Best Practices
- Standardize your data source columns first — platform, niche, tier, and content type values should be consistent every campaign.
- Connect the .pbix to your existing Excel or SharePoint source rather than copying data into the file each time.
- Save monthly snapshots so you can compare year-over-year trend lines on the Trend Analysis page.
- Hide the slicer panel when exporting to PDF for board reports so the page reads cleanly.
- Re-evaluate your Top Five Influencers list every quarter — creators churn faster than most brands assume.
Explore Relevant Templates
Also available as the Influencer Campaign Dashboard in Excel and Influencer Campaign Dashboard in Google Sheets — same KPI structure on different platforms. Pick whichever your team already runs.
- Multi-Platform Social Media Calendar in Excel — the planning companion to this analytics dashboard.
- Nonprofit Grant Dashboard in Power BI — same .pbix architecture for grant tracking.
- Browse all Power BI Dashboards in our library.
Frequently Asked Questions
What KPIs does the Influencer Campaign Dashboard in Power BI track?
The Influencer Campaign Dashboard in Power BI tracks 5 primary KPIs — Total Campaigns, Total Revenue, Total Conversions, Total Impressions, and Total Influencer Fee — plus engagement rate, conversion rate, and ROI across 16 visuals on dedicated Platform, Niche, Influencer, and Trend pages.
Do I need a paid Power BI license to use this dashboard?
No paid license is required. The Influencer Campaign Dashboard in Power BI runs on Power BI Desktop, which Microsoft offers as a free download. Power BI Pro or Premium is only needed if you want to publish and share reports through the Power BI Service cloud platform.
How long does setup take?
Setup takes under 10 minutes. Open the .pbix file in Power BI Desktop, point the data model at your campaign source (Excel, CSV, SQL, or any Power BI connector), click Refresh, and all five report pages and 16 visuals update automatically.
How does this compare to Aspire, GRIN, or Modash?
Aspire, GRIN, and Modash cost $200–1000+ per month and add creator discovery, outreach, and contract management. The Influencer Campaign Dashboard in Power BI is a one-time $17.99 purchase focused purely on campaign analytics — the same KPI and ROI views, with zero recurring cost.
Can I add my own visuals or DAX measures?
Yes. The Influencer Campaign Dashboard in Power BI is fully editable. Add new DAX measures, build extra visuals, rename KPI cards, swap brand colors, and extend the data model with new metric columns — the file is a standard .pbix with full Power BI access.
Does it work with Excel data?
Yes. The Influencer Campaign Dashboard in Power BI connects to Excel files (.xlsx) as a primary source. You can also wire it to CSVs, SharePoint lists, SQL databases, or any of the 100+ data connectors Power BI Desktop supports out of the box.
What if I want a non-Power BI version?
The same dashboard is available as the Influencer Campaign Dashboard in Excel and Influencer Campaign Dashboard in Google Sheets. The KPI structure and pages match closely — pick the platform your team already uses.
About the Author
Built by PK — Microsoft Certified Professional with 15+ years of Excel, Google Sheets, and Power BI experience. Founder of NextGenTemplates, reaching 300K+ subscribers across YouTube channels (@PK-AnExcelExpert, @NextGenTemplates, @NeoTechNavigators). Every template is hand-built and tested before release.
Conclusion
If you are running influencer marketing at a brand or agency — and especially if you have ever sat in a Monday meeting trying to defend ROI from a messy spreadsheet — the Influencer Campaign Dashboard in Power BI is built for you. Five KPI cards, 16 pre-built visuals, and five interactive report pages give you the same campaign-analytics depth that paid SaaS platforms charge $200–1000+ per month for, at a one-time cost of $17.99.
🛍️ Click here to Purchase the Influencer Campaign Dashboard in Power BI
✅ Instant download · One-time payment · No subscription · Lifetime access
🎥 Visit YouTube.com/@PK-AnExcelExpert for step-by-step Power BI tutorials.