Print businesses track an average of 8–15 job categories simultaneously, yet most owners still rely on scattered spreadsheets with no consistent margin tracking, operator visibility, or profitability breakdown by region or delivery type. The Print Shop Dashboard in Excel solves this with 5 interactive analysis pages, 16+ pre-built charts, multi-slicer filtering, and 5 KPI cards — all powered by a single pivot engine that refreshes every visual in one click. Setup takes under 10 minutes.
Join 8,400+ teams in 40+ countries using NextGenTemplates to replace expensive SaaS subscriptions with one-time-purchase Excel, Google Sheets, Power BI, and HTML templates that actually match how small and mid-size businesses work.
👉 Click here to Purchase the Print Shop Dashboard in Excel
Key Features of Print Shop Dashboard in Excel
The Print Shop Dashboard in Excel delivers 5 dedicated analysis pages with 16+ pre-built charts powered by a hidden pivot engine on the Support sheet. The dashboard tracks 5 headline KPIs — Total Records, Total Revenue, Total Cost, Net Profit, and Total Quantity — plus chart-level metrics including Profit Margin % by Region, Completion %, Revenue by Print Type, Turnaround Days by Delivery Type, and Net Profit by Customer Type.
Interactive Multi-Slicer Filtering: Every page includes slicers for Region, Print Type, Product Category, Customer Type, Payment Method, Color Mode, Paper Type, Delivery Type, Status, and Operator. A single click on any slicer instantly cascades across all charts and KPI cards on that page.
5 KPI Cards on Overview: The Overview page displays Total Records, Total Revenue, Total Cost, Net Profit, and Total Quantity — the five numbers every print shop owner or manager needs before diving into analysis — calculated dynamically from the Data sheet using SUMIFS-driven formulas.
Pivot-Driven One-Click Refresh: After updating the Data sheet, click Data > Refresh All in the Excel ribbon. Every pivot table on the Support sheet refreshes simultaneously, updating all 16+ charts and 5 KPI cards in 1–2 seconds. According to Microsoft Support’s PivotTable refresh documentation, Refresh All is the fastest way to update all connected pivots in a workbook.
Operations Visibility: The Operations page tracks job completion %, status distribution, operator workload by record count, and turnaround days by delivery type — giving production managers full visibility into bottlenecks before they become missed deadlines.
Profitability Analysis: The Profitability page isolates net profit vs revenue by region, profit margin % by delivery type, net profit by customer type, and completion % by print type — making it clear which service lines and regions are actually worth growing.
Dashboard Pages Explanation
1. Overview Page
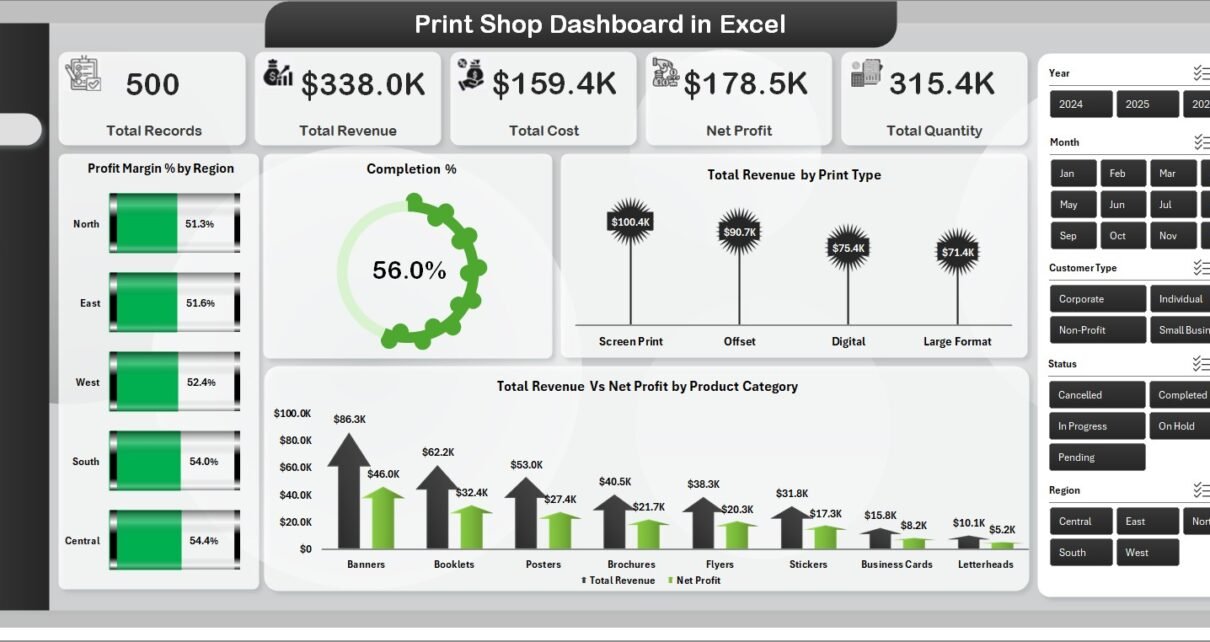
The Overview page is the executive layer of the Print Shop Dashboard in Excel. Five KPI cards run across the top: Total Records, Total Revenue, Total Cost, Net Profit, and Total Quantity. Below the cards, four charts give an immediate performance snapshot: Profit Margin % by Region identifies which geographic areas deliver the highest margins; Completion % shows the overall job completion rate across the portfolio; Total Revenue by Print Type breaks down revenue concentration by service line (digital, offset, large-format, etc.); and Total Revenue vs Net Profit by Product Category shows which categories generate revenue but erode margin.
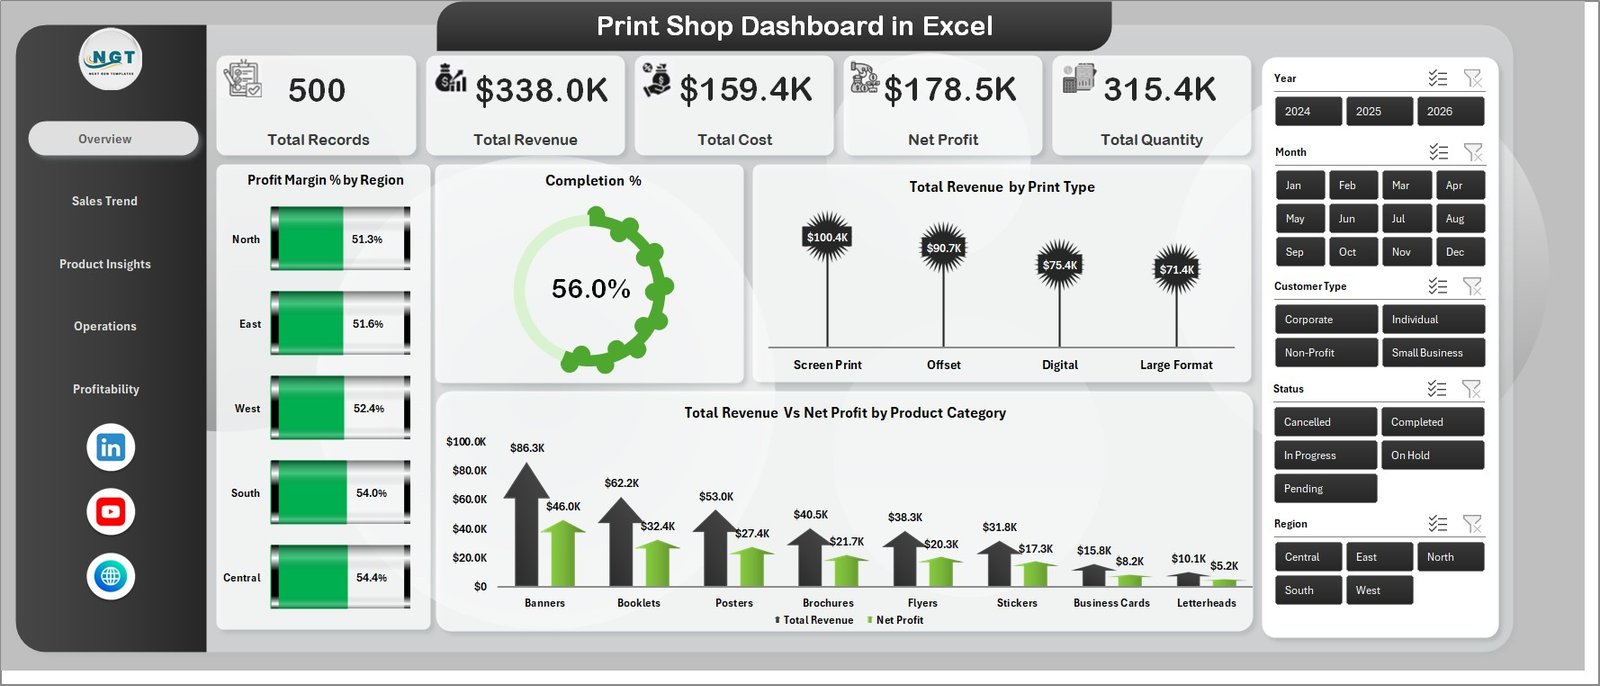
Overview Page — 5 KPI Cards and 4 Analysis Charts
2. Sales Trend
The Sales Trend page answers one core question: which months, customers, and payment methods drive the most revenue and profit? Four charts deliver this: Total Revenue vs Net Profit by Month reveals seasonality and monthly profit compression; Net Profit by Print Type shows which service lines are most profitable month-to-month; Total Revenue by Customer Type segments revenue between B2B and B2C clients (or however the print shop classifies its customer base); and Total Records by Payment Method shows which payment types are most common — useful for understanding cash flow timing and processing cost exposure.
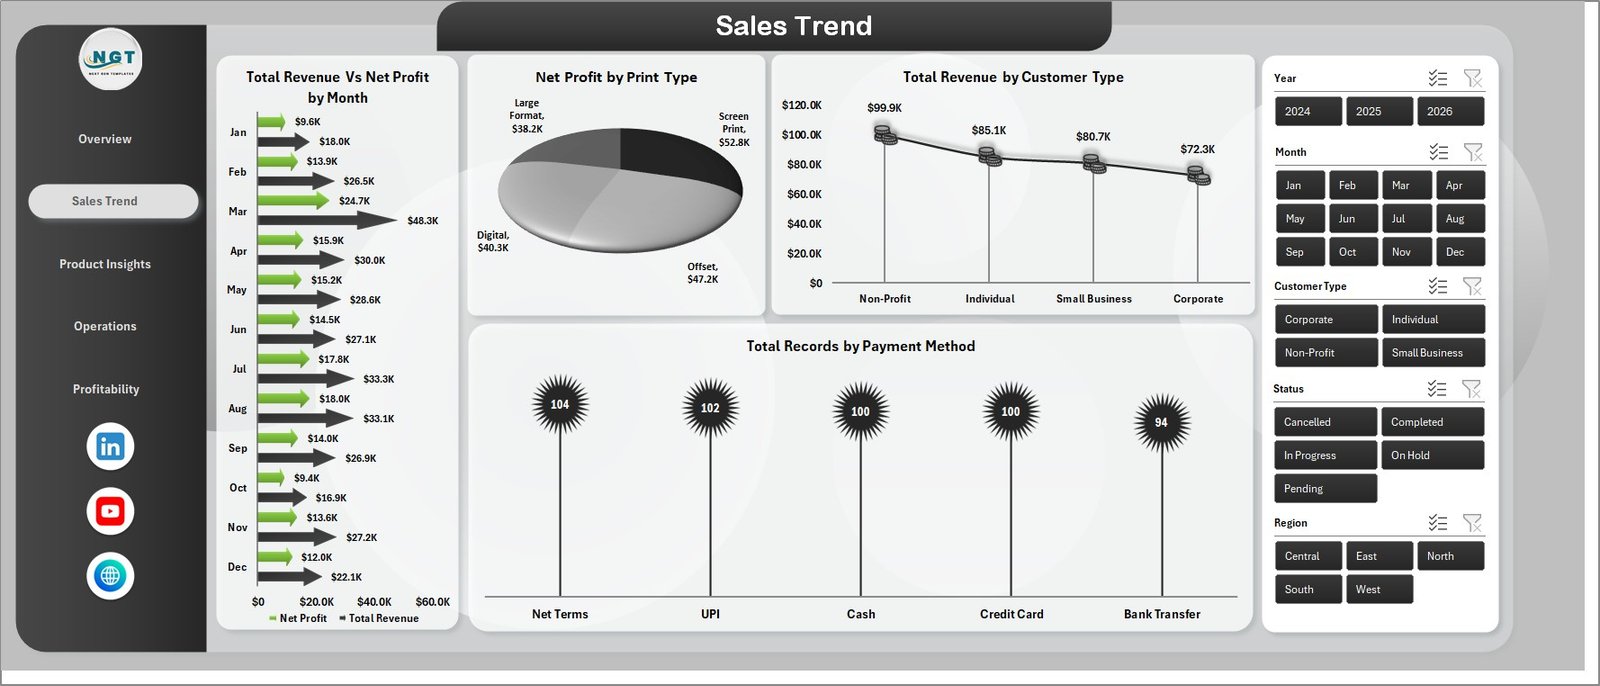
Sales Trend — Revenue vs Profit by Month and Customer Type Analysis
3. Product Insights
The Product Insights page is where the Print Shop Dashboard in Excel gets specific about what’s driving revenue and cost at the product level. Total Revenue by Product Category shows which categories (e.g., business cards, banners, brochures, packaging) generate the most revenue. Total Revenue by Color Mode segments whether color or mono printing dominates the revenue mix. Total Quantity by Paper Type shows which paper stock moves most by volume — critical for inventory planning. Total Cost by Print Type breaks down where production costs are concentrated across service types.
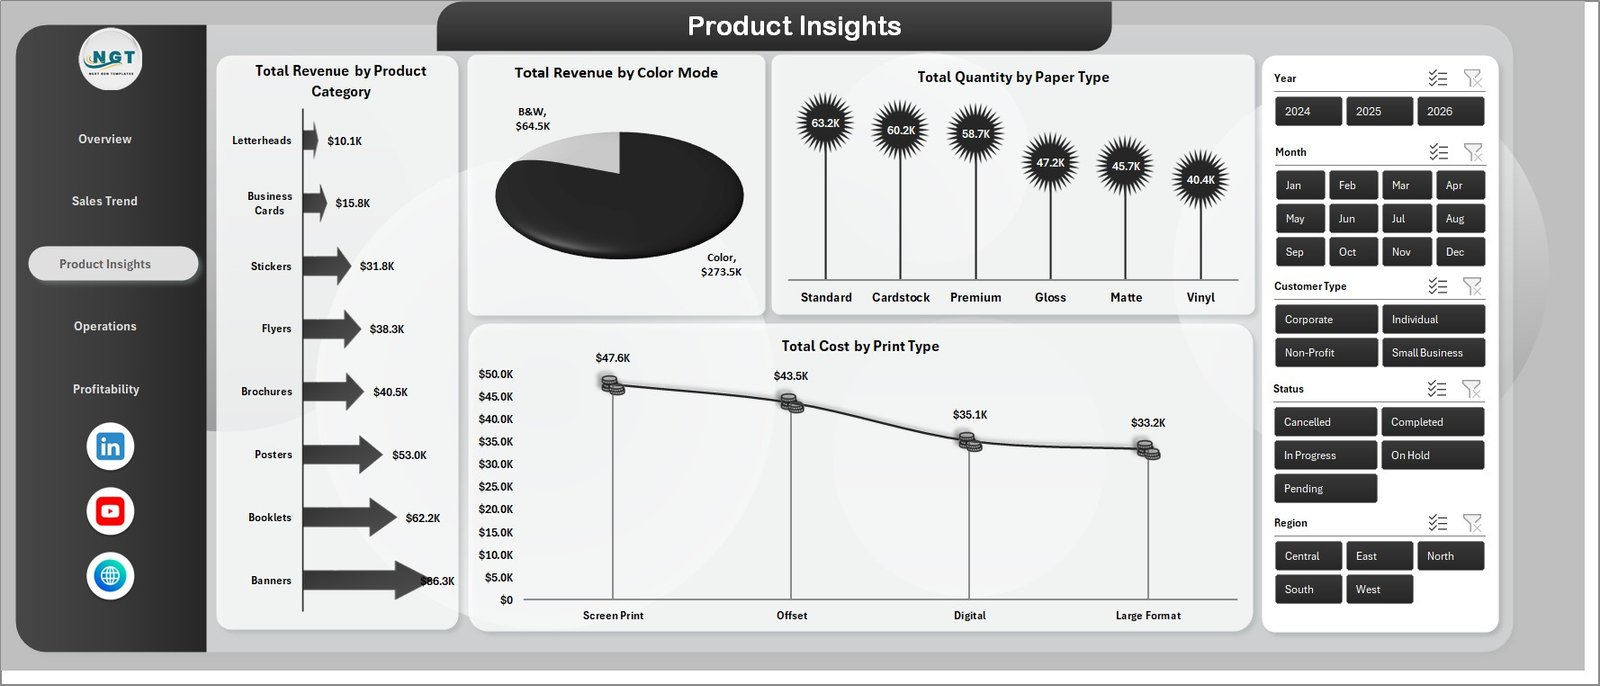
Product Insights — Revenue by Category, Color Mode, Paper Type, and Print Type Cost
4. Operations
The Operations page gives production managers the view they need to prevent bottlenecks. Total Records by Operator shows workload distribution — if one operator is handling 60% of jobs, that’s a capacity risk. Total Quantity by Color Mode breaks down color vs mono production volume. Total Records by Status shows how many jobs are pending, in progress, or completed at any given snapshot. Total Records vs Turnaround Days by Delivery Type is the most operationally actionable chart: it shows whether express or standard delivery jobs are hitting their turnaround targets and where delays cluster.
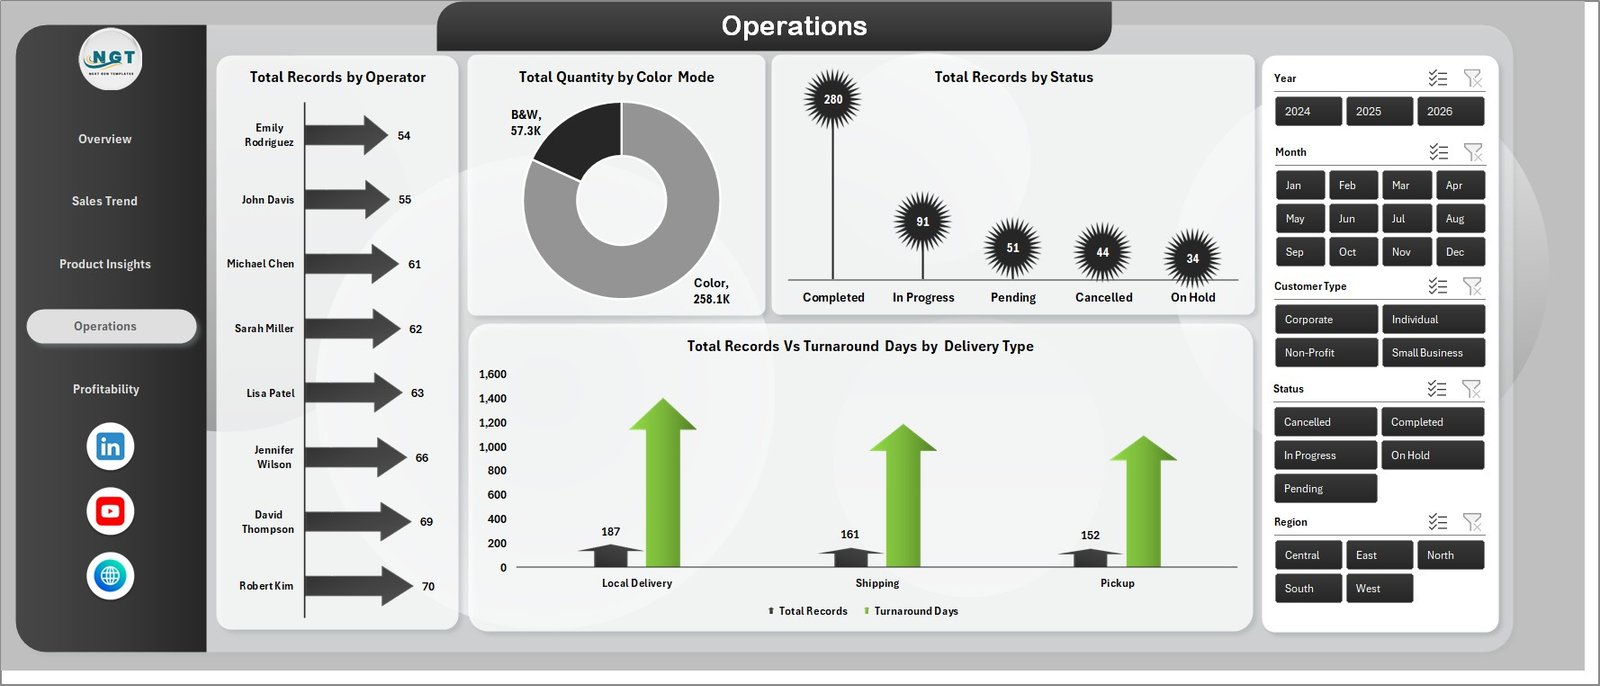
Operations — Operator Workload, Status Distribution, Turnaround Days by Delivery Type
5. Profitability
The Profitability page is the most strategic view in the Print Shop Dashboard in Excel. Net Profit vs Revenue by Region shows which regions generate revenue but thin margins — often a signal of pricing pressure or higher delivery costs in those areas. Profit Margin % by Delivery Type answers a critical question: does express delivery actually earn a premium margin, or does the faster turnaround cost more than it charges? Net Profit by Customer Type shows whether B2B or B2C clients generate better bottom-line results. Completion % by Print Type flags which service lines have operational issues (low completion % often signals equipment bottlenecks or material shortages).
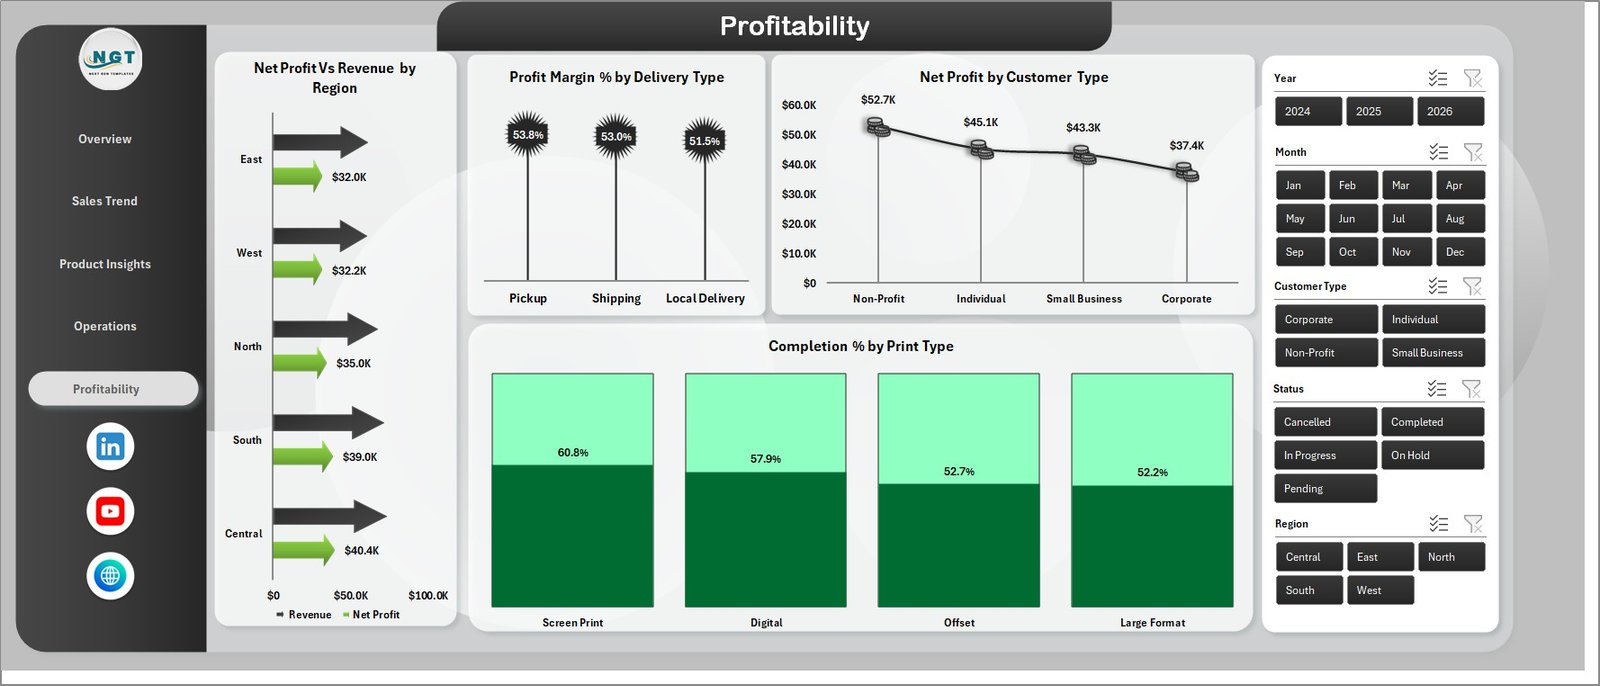
Profitability — Net Profit by Region, Delivery Type Margins, Customer Type Analysis
6. Data Sheet
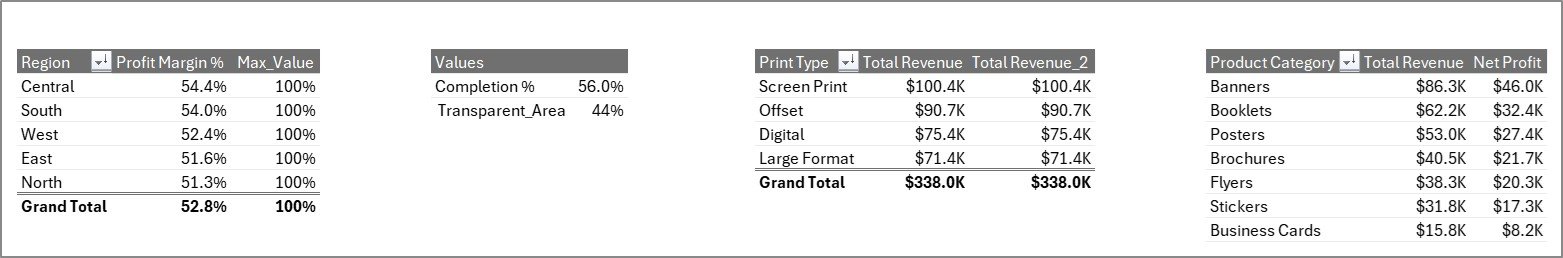
The Data Sheet is the single source of truth for the entire Print Shop Dashboard in Excel. All job-level records are entered here with structured columns covering date, job category, print type, color mode, paper type, region, operator, customer type, delivery type, status, revenue, cost, quantity, turnaround days, and payment method. Replace the sample rows with your own data using the same column format and the dashboard updates after one Refresh All click.

Data Sheet tab — Structured Data Entry for Job-Level Records
7. Support Sheet
The Support Sheet houses all pivot tables that power the Print Shop Dashboard in Excel. Every chart and KPI card on all five analysis pages draws its data from pivot tables on this sheet. After updating the Data Sheet, go to Data > Refresh All in the Excel ribbon — every pivot refreshes simultaneously. Keep this sheet hidden in production by right-clicking the tab and selecting Hide; it doesn’t need to be visible to users interacting with the dashboard pages.
Support sheet tab — Pivot Tables Powering the Dashboard
Print Shop Dashboard in Excel vs. Google Sheets vs. Printavo — Feature Comparison
| Feature | Print Shop Dashboard in Excel | Google Sheets Equivalent | Printavo / PrintSmith |
|---|---|---|---|
| Cost | $17.99 one-time | $9–15 one-time | $89–299 / month |
| Platform | Microsoft Excel (offline) | Google Sheets (browser) | Cloud SaaS |
| Setup time | Under 10 minutes | Under 15 minutes | 2–5 days (integrations) |
| Profit margin by print type | ✅ Pre-built | Manual setup | ✅ Auto-tracked |
| Operations & turnaround tracking | ✅ Pre-built | Manual setup | ✅ Auto-tracked |
| Works offline / private data | ✅ | ❌ | ❌ |
| Customizable formulas | ✅ Full Excel access | ✅ Apps Script | Limited (UI only) |
| Year-1 cost at 5 users | $17.99 | $9–15 | $1,068–$3,588 |
| No per-user fee | ✅ | ✅ | ❌ |
For print shop owners who want revenue, profitability, and operations visibility in one Excel file without paying $1,000+ per year for SaaS, the Print Shop Dashboard in Excel sits in the sweet spot.
Who Should Use This Template
Perfect for:
- Print shop owners and managers tracking daily job revenue, cost, and profit margin across print types and regions
- Operations managers monitoring job status, operator workload, and turnaround times by delivery type
- Print business consultants delivering monthly performance reports to clients in a repeatable, branded format
- Finance teams at printing companies needing a lightweight dashboard without expensive BI subscriptions
- Excel-comfortable professionals who don’t want to pay $89–299/month for print management SaaS software
Not a fit if:
- You need real-time API sync with your print MIS or POS system (use Printavo, PrintSmith, or Tharstern)
- Your team works exclusively in Google Sheets (a Google Sheets version is available separately)
- You require SOC 2-compliant cloud BI with role-based access control (use Looker or Power BI Premium)
- You need automated job ticketing, customer portal, or quotation generation features
Real-World Use Cases
Rajan runs a 6-person commercial print shop in Pune offering digital, offset, and large-format printing. He uses the Print Shop Dashboard in Excel every Monday to review last week’s revenue by print type and net profit by region. The Profitability page surfaced that large-format jobs carried a 34% profit margin versus 18% for offset — he shifted outbound sales calls to upsell large-format and grew monthly net profit by 22% over one quarter. Replaced his $199/month PrintSmith reporting module with this $17.99 file.
Divya manages finance for a 15-person printing company in Bangalore with B2B clients across three regions. She uses the Operations page to track average turnaround days by delivery type and exports the dashboard as a PDF for the monthly leadership review. Before this template, building the same report manually in Google Sheets took 4 hours each month. Now it takes 15 minutes.
A print business consultant in Mumbai manages analytics for five mid-size print shop clients. She drops each client’s monthly job export into a copy of the Print Shop Dashboard in Excel and delivers a 5-page branded performance report. Setup per client takes under 12 minutes — the template paid for itself during the first client engagement.
Advantages of Print Shop Dashboard in Excel
The primary advantage of the Print Shop Dashboard in Excel over manual spreadsheet tracking is the pivot-driven automatic update behavior: paste new job records into the Data Sheet, click Refresh All, and all 16+ charts and 5 KPI cards update simultaneously. Teams that previously spent 3–5 hours reformatting monthly pivot tables reduce that effort to under 15 minutes.
The five dedicated analysis pages (Overview, Sales Trend, Product Insights, Operations, Profitability) map directly to how print businesses ask questions: financial performance, product mix, operational capacity, and profit by service line — in one file, without switching between tabs or reconciling different data sources.
Because the dashboard uses native Excel pivot tables and slicers with no macros or add-ins, there are no macro security warnings, no IT approval requirements, and no version-compatibility issues. Any team member with Excel 2016 or later can open, update, and share the file.
Opportunities for Improvement
The Print Shop Dashboard in Excel is a manual reporting tool — it does not auto-import data from print MIS platforms, job management systems, or POS software. Teams that want automated data ingestion should set up a scheduled CSV export from their existing system and paste it into the Data Sheet monthly.
The template also does not include built-in capacity planning, job costing at the material level, or customer CRM history. For businesses that need deeper job-level costing, pairing this dashboard with a job cost tracking spreadsheet covers the gap without additional software investment.
Best Practices
- Standardize the Data Sheet column values (print types, regions, operator names) before your first data entry session so slicer filters stay consistent across months.
- Use a consistent date format (YYYY-MM-DD) across the Data Sheet to ensure the Sales Trend monthly grouping works correctly.
- Archive each month’s completed Data Sheet before overwriting with new data — this builds a historical record without requiring a separate system.
- Hide the Support Sheet in production by right-clicking the tab and selecting Hide, so business users don’t accidentally modify the pivot tables.
- Before sharing with management, clear all slicers to reset to the full dataset view — stale slicer selections cause more confusion than any other dashboard issue.
Explore Relevant Templates
📌 Dropshipping Dashboard in Excel — 5-page analytics workbook for multi-channel ecommerce operators tracking ROAS, supplier costs, and customer geography.
📌 SaaS Product Usage Dashboard in Excel — pivot-driven MRR and churn tracking for software businesses using the same dashboard architecture.
📌 Garden Center Dashboard in Excel — retail operations dashboard for specialty businesses tracking product category revenue and seasonal trends.
📌 Bakery KPI Scorecard in Excel — KPI scorecard template for small business owners tracking production, sales, and profitability in Excel.
📌 Browse all Excel Dashboard Templates on NextGenTemplates.com
Frequently Asked Questions
What KPIs does the Print Shop Dashboard in Excel track?
The Print Shop Dashboard in Excel tracks 5 core KPIs: Total Records, Total Revenue, Total Cost, Net Profit, and Total Quantity. It also includes 16+ chart-level metrics including Profit Margin % by Region, Completion %, Net Profit by Print Type, Turnaround Days by Delivery Type, and Total Revenue by Customer Type — all updating automatically from the Data sheet.
How long does setup take?
Setup takes under 10 minutes. Open the Print Shop Dashboard in Excel, paste your job-level data into the Data sheet keeping the column headers as-is, and click Data > Refresh All. Every chart, KPI card, and slicer updates automatically through the pre-built pivot engine on the Support sheet.
How does this compare to Printavo or PrintSmith?
The Print Shop Dashboard in Excel is a $17.99 one-time purchase versus Printavo’s $89–299 monthly subscription. The trade-off is manual data import (CSV from your system) versus Printavo’s auto-sync. For shops under $1M annual revenue, the Excel option saves $1,000–$3,500+ per year with no per-user fees.
Which versions of Excel does this support?
The Print Shop Dashboard in Excel runs on Excel 2016 and later for Windows and Mac, and on Microsoft 365. Slicers and pivot tables are fully supported across all these versions. It is not compatible with Excel 2013 or earlier due to slicer limitations in older versions.
Can I track multiple print shop locations or branches?
Yes. Add a Location or Branch column to the Data sheet and slicers will auto-populate from your data on the next Refresh All click. No formula edits are required — the pivot tables pick up new columns automatically.
Is my financial data private?
Yes. The Print Shop Dashboard in Excel is a local file — your job data, revenue figures, customer names, and operator performance stay on your computer. There is no cloud sync, no telemetry, and no third-party access of any kind.
Can I customize the dashboard colors and add my logo?
Yes. The dashboard uses standard Excel chart formatting. Edit colors via the workbook theme, replace fonts, and insert your company logo on any page. All pivot tables and slicers are fully unlocked and editable without breaking the refresh architecture.
About the Author
Built by PK — Microsoft Certified Professional with 15+ years of Excel, Google Sheets, and Power BI experience. Founder of NextGenTemplates, reaching 300K+ subscribers across YouTube channels (@PK-AnExcelExpert, @NextGenTemplates, @NeoTechNavigators). Every template is hand-built and tested before release.
Conclusion
The Print Shop Dashboard in Excel gives print shop owners, operations managers, and business consultants revenue, profitability, and operational visibility across 5 dedicated analysis pages and 16+ pre-built charts — all from a single native Excel file with no macros, no subscriptions, and no per-user fees. At $17.99 with a one-time payment, it replaces hours of monthly reporting work and the $1,000+ annual cost of print management SaaS reporting modules.
Click here to Purchase the Print Shop Dashboard in Excel
✅ Instant download · One-time payment · No subscription · Lifetime access
🎥 Youtube.com/@PK-AnExcelExpert — Watch step-by-step Excel dashboard tutorials.
📅 Last updated: May 2026