The landscaping and lawn care industry generates over $100 billion annually in the US, with the average company managing dozens of active projects, multiple crew leaders, and service deliveries across different geographic regions. Yet most landscaping businesses still rely on scattered spreadsheets to understand where revenue is coming from, which services are most profitable, and how each crew leader is performing. The Landscaping Dashboard in Power BI changes that — bringing 5 KPI cards, 5 interactive analysis pages, and multi-dimensional slicers into a single .pbix file you can connect to your own data in under 10 minutes.
This post walks you through every page of the dashboard, explains the charts and KPIs in detail, and shows you exactly how to use this Power BI template to make faster, more profitable decisions for your landscaping business.
Key Features of the Landscaping Dashboard in Power BI
The Landscaping Dashboard in Power BI is built around the five dimensions that drive landscaping business performance: revenue trends, service profitability, client value, regional results, and crew operations.
- 5 KPI cards on the Overview page — Total Revenue, Net Profit, Total Projects, Total Material Cost, and Hours Variance give you an instant read on business health.
- Service-level profitability analysis — Breaks down hours, revenue per project, and material cost by each service type so you know which services to grow and which to reprice.
- Client type segmentation — Compares revenue, project volume, and customer satisfaction across client categories such as residential, commercial, and government.
- Regional performance view — Puts actual hours, net profit, and total cost vs. revenue for each region side-by-side for fast geographic comparison.
- Crew leader scorecards — Ranks every crew leader by revenue generated and completion rate so performance conversations are anchored in data.
- Cross-page slicers — Filter the entire report by service type, region, client type, date range, or crew leader in one click.
- Single .pbix file, no subscription needed — Works with the free Power BI Desktop from Microsoft; no paid license required to open and edit.
For a deeper look at how Power BI connects to Excel data sources, see the official Power BI data sources documentation on Microsoft Learn.
Dashboard Pages Explanation
The dashboard ships as a single .pbix file with 5 report pages, each focused on a different dimension of your landscaping business.
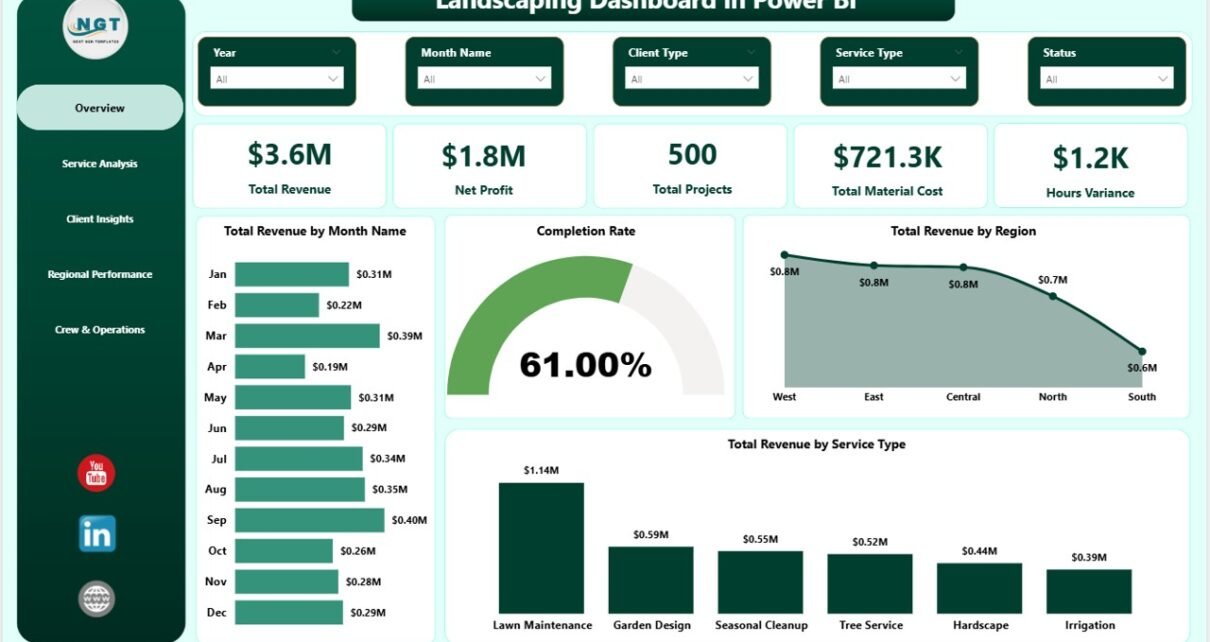
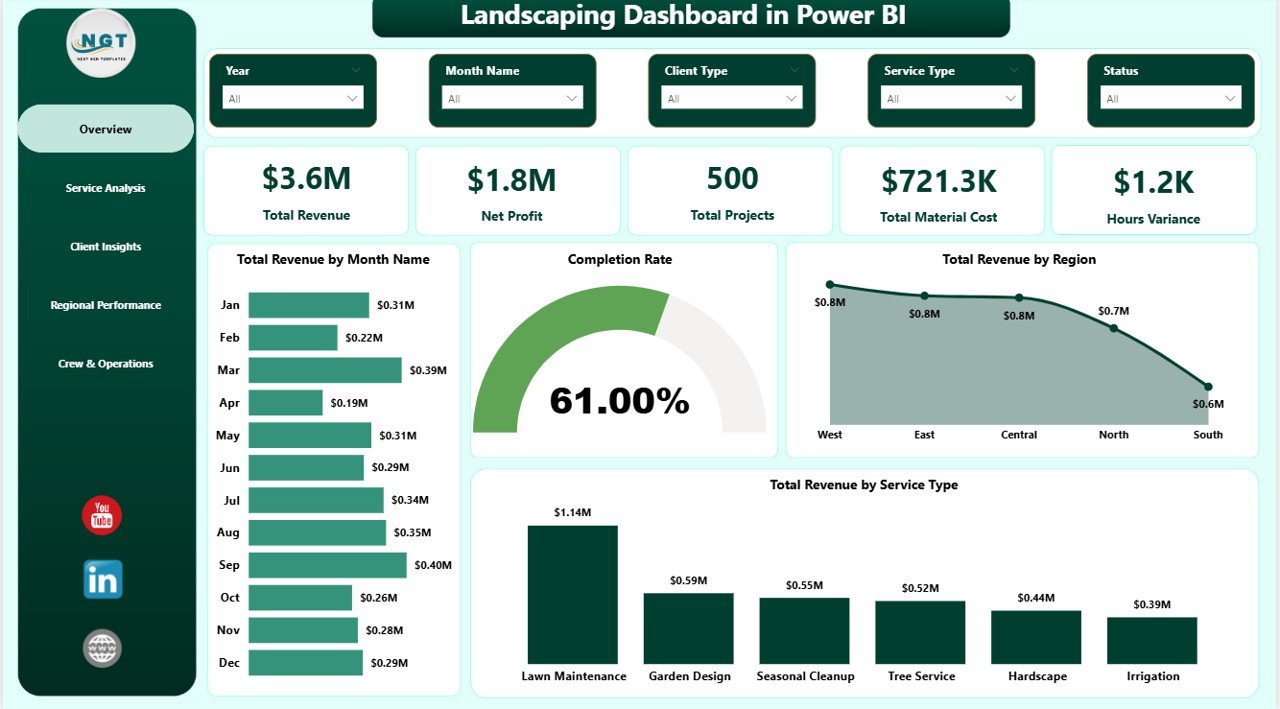
Page 1 — Overview
The Overview page is the command center of the Landscaping Dashboard in Power BI. At the top, 5 KPI cards display high-level business health at a glance: Total Revenue (total project billings for the period), Net Profit (revenue minus all costs), Total Projects (count of completed and active jobs), Total Material Cost (total spend on plants, mulch, stone, and other materials), and Hours Variance (budgeted vs. actual crew hours, a key productivity proxy). Below the cards, four charts present trend and breakdown analysis: Total Revenue by Month Name shows the monthly revenue trend line; Completion Rate shows the percentage of projects delivered on time; Total Revenue by Region breaks revenue across service territories; and Total Revenue by Service Type reveals which service categories are driving the most billing. Multiple slicers allow you to filter the entire view by any dimension combination.
Landscaping Dashboard in Power BI – Overview Page
Page 2 — Service Analysis
The Service Analysis page zooms into operational performance at the service type level. Three charts provide a complete profitability picture: Total Actual Hours by Service Type reveals which services consume the most crew time; Average Revenue Per Project by Service Type shows which services generate the highest average billing per job; and Total Material Cost by Service Type tracks where your supply spend is concentrated. Together these charts answer the critical question: which services are most profitable, and which need repricing? The page allows filtering by region, date, and client type to isolate specific service performance in specific contexts.
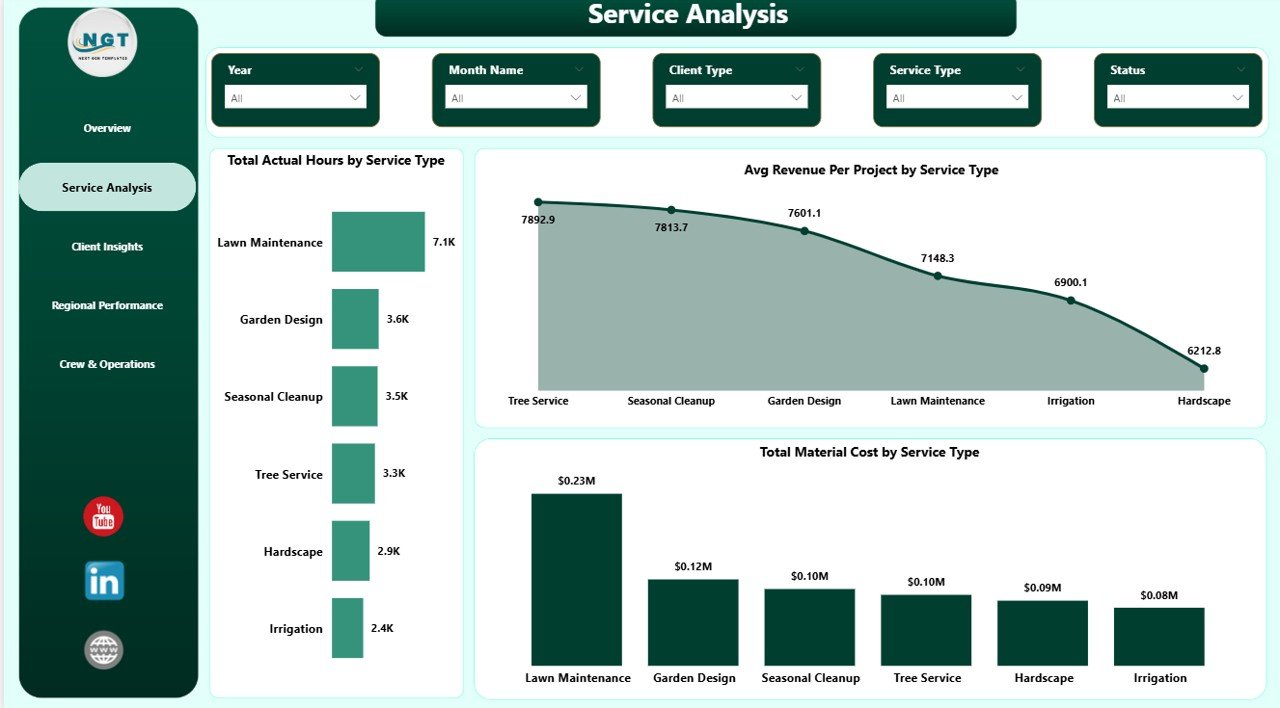
Landscaping Dashboard in Power BI – Service Analysis
Page 3 — Client Insights
The Client Insights page segments your business by client type. Three visualizations show Total Revenue by Client Type, Total Projects by Client Type, and Average Customer Satisfaction by Client Type. This page is particularly useful for identifying whether commercial, residential, or other client segments deliver the highest lifetime value — and whether satisfaction levels differ across those segments. Low satisfaction in a high-revenue client type is an early churn warning signal that owners can act on before it becomes a loss.
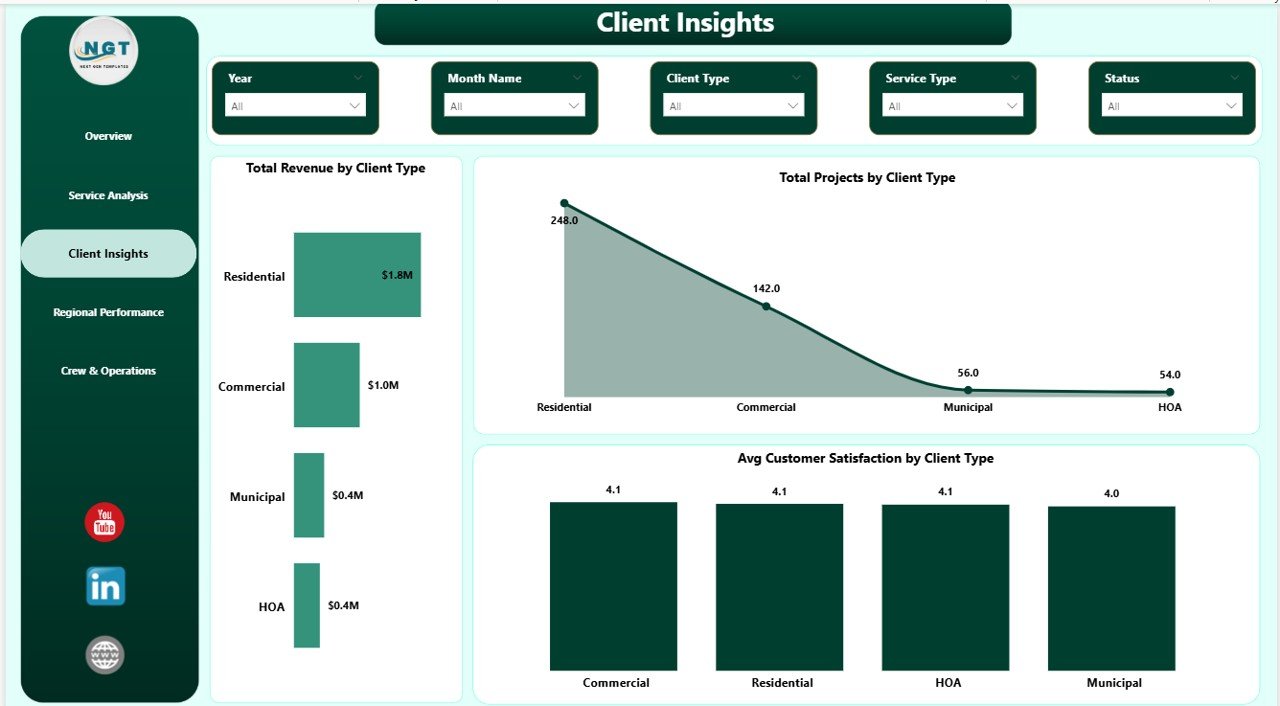
Landscaping Dashboard in Power BI – Client Insights
Page 4 — Regional Performance
The Regional Performance page enables geographic business analysis. Total Actual Hours by Region shows which territories consume the most crew time; Net Profit by Region reveals which areas are most profitable after all costs; and Total Revenue and Overall Cost by Region presents revenue vs. total cost side-by-side per region, making cost overruns immediately visible. Landscaping companies with multiple service territories can use this page to decide where to add crews, where to renegotiate contracts, and where margins are too thin to sustain at current pricing.
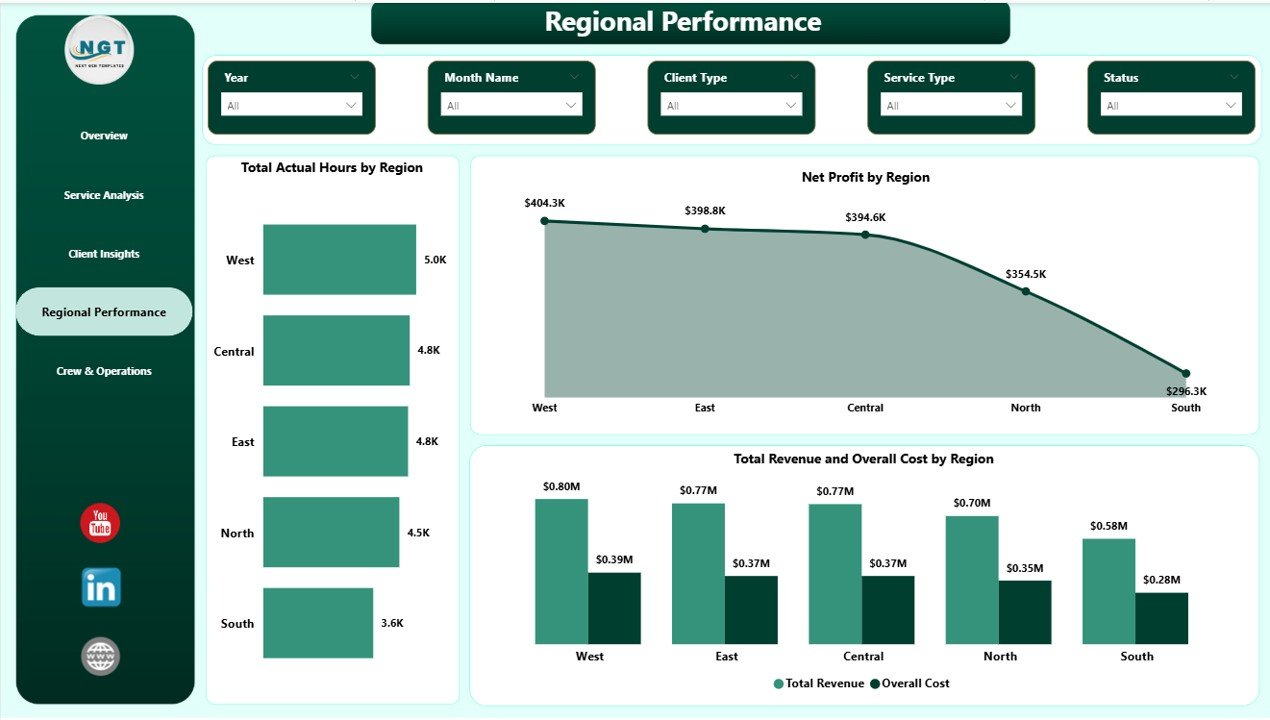
Landscaping Dashboard in Power BI – Regional Performance
Page 5 — Crew & Operations
The Crew & Operations page provides visibility into individual crew leader performance. Total Projects by Client Type shows the distribution of job types each leader handles; Total Revenue by Crew Leader ranks leaders by total billing generated; and Completion Rate by Crew Leader shows on-time delivery rate per leader. These three metrics give owners a fair, data-driven picture of who is excelling and who may need support — without cross-referencing multiple spreadsheets.
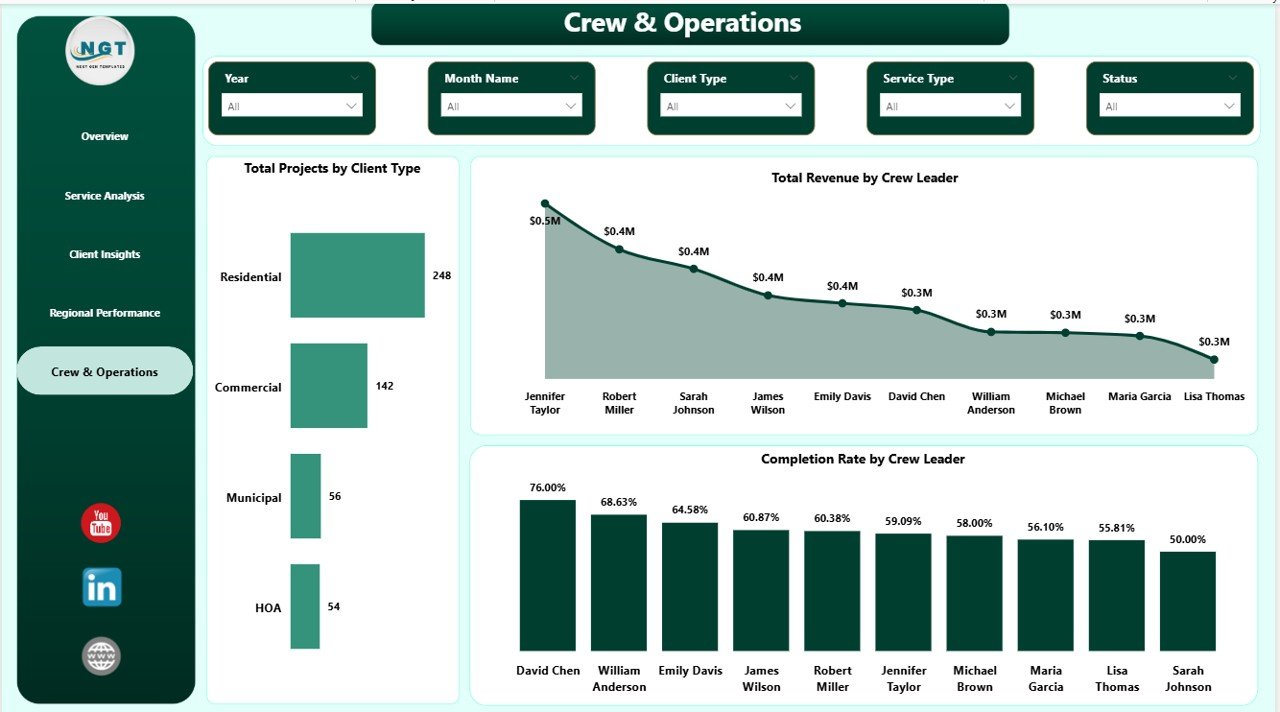
Landscaping Dashboard in Power BI – Crew & Operations
Landscaping Dashboard in Power BI vs. Excel Dashboard vs. ServiceTitan — Feature Comparison
| Feature | Landscaping Dashboard in Power BI | Excel Dashboard | ServiceTitan / Aspire |
|---|---|---|---|
| Cost | $17.99 one-time | $17.99 one-time | $125–200/user/month |
| Platform | Power BI Desktop (free) | Microsoft Excel required | Cloud SaaS |
| Setup time | ✅ Under 10 minutes | ✅ Under 10 minutes | Weeks + paid onboarding |
| Service type analysis | ✅ Hours + Revenue + Cost | Varies | ✅ Built-in |
| Regional performance | ✅ Profit + Revenue + Cost | Varies | ✅ Built-in |
| Crew performance | ✅ By crew leader | Varies | ✅ Built-in |
| Customizable fields | ✅ Full Power Query control | ✅ Full control | Limited |
| No subscription required | ✅ Yes | ✅ Yes | ❌ Ongoing subscription |
| Year-1 cost at 5 users | $17.99 total | $17.99 total | $7,500–$12,000+ |
For landscaping businesses that want enterprise-level analytics without enterprise-level SaaS pricing, the Landscaping Dashboard in Power BI sits in the sweet spot.
Who Should Use This Template
Perfect for:
- Landscaping and lawn care business owners tracking monthly revenue, profit, and crew performance
- Operations managers comparing service type margins and regional results across territories
- Small-to-mid landscaping companies (2–200 employees) wanting SaaS-level reporting without a SaaS subscription
- Power BI users wanting a ready-made template to connect to their own data immediately
- Business analysts building monthly performance reviews for landscaping or field service companies
Not a fit if:
- You need a fully integrated CRM, scheduling, and invoicing platform — look at ServiceTitan or Aspire instead
- You prefer to work entirely in Excel — try the Landscaping Dashboard in Excel from our blog
- You need enterprise SSO or advanced data governance for Power BI reports
Real-World Use Cases
Marcus runs a 15-crew landscaping operation in the Southeast. He connects his monthly job records to the Landscaping Dashboard in Power BI and walks his regional managers through a 10-minute review each month — without paying $1,500/month for Aspire. The Regional Performance page lets him spot which territories are running over-budget before the quarter closes.
Priya is an operations manager at a multi-service lawn care company. She uses the Service Analysis page to compare margins across mowing, irrigation, and hardscaping — then reallocates crew hours from low-margin to high-margin services. That analysis used to take a full day in Excel; now it takes 10 minutes in Power BI.
Derek owns a landscaping franchise with 8 crew leaders. The Crew & Operations page shows Total Revenue and Completion Rate by crew leader side-by-side — so he can recognize top performers in monthly team meetings and provide targeted coaching to leaders who need support.
Advantages of the Landscaping Dashboard in Power BI
- One-time cost: $17.99 vs. thousands per year for SaaS analytics tools — significant ROI in the first month
- Multi-dimensional analysis: Covers all 5 critical performance dimensions in a single report file
- Power BI’s visual editor: Easy to add new visuals, measures, or pages without writing complex code
- Data stays private: Your landscaping data lives in your own environment — no third-party servers required
- Export to PDF: Share read-only report snapshots with stakeholders who don’t have Power BI Desktop
Opportunities for Improvement
- No built-in scheduling module: The dashboard is analytics-only and doesn’t schedule jobs or dispatch crews
- Requires basic Power BI knowledge: Connecting your own data via Power Query is straightforward but assumes some familiarity with Power BI Desktop
- Static data refresh: The dashboard refreshes from Excel/CSV data on demand; live streaming requires Power BI Pro and API integration
Best Practices
- Update your source Excel data monthly and click Refresh in Power BI Desktop to keep reporting current
- Match your column names to the sample data structure in Power Query to avoid broken measures
- Use the Overview page for leadership reviews; use Service Analysis and Crew pages for operational team meetings
- Export individual pages to PDF from Power BI Desktop to share snapshots with stakeholders who don’t use Power BI
- Add a custom date column in your source data to enable time intelligence filters such as YTD and QTD comparisons
Explore Relevant Templates
Looking for related dashboards? These templates on NextGenTemplates complement this workflow:
- Landscaping Dashboard in Excel — same KPIs and 5-page structure, built for Microsoft Excel with pivot tables and slicers
- Construction Dashboard in Excel — project cost and milestone tracking for construction companies
- Landscaping Dashboard in Power BI — purchase the template directly on NextGenTemplates
Also see our related posts: Landscaping Dashboard in Excel and Plumbing Contractor Dashboard in Excel.
Frequently Asked Questions
What KPIs does the Landscaping Dashboard in Power BI track?
The Landscaping Dashboard in Power BI tracks 5 headline KPIs: Total Revenue, Net Profit, Total Projects, Total Material Cost, and Hours Variance. All KPIs display on the Overview page and refresh automatically when you update your data source in Power BI Desktop.
Do I need a paid Power BI license to use this dashboard template?
No. The Landscaping Dashboard in Power BI works with Power BI Desktop, which is completely free to download from Microsoft. A paid Power BI Pro license is only required if you want to publish and share the report via Power BI Service.
How long does setup take for this Power BI landscaping template?
Setup typically takes under 10 minutes. Download and unzip the file, open in Power BI Desktop, use Power Query’s Change Source to connect your own Excel or CSV data, then click Refresh. All 5 report pages update automatically with your data.
How does the Landscaping Dashboard in Power BI compare to ServiceTitan or Aspire?
ServiceTitan and Aspire are full-featured field service management platforms costing $125–200 per user per month. The Landscaping Dashboard in Power BI is an analytics and reporting template at a one-time cost of $17.99 — the right tool for companies that manage operations elsewhere and need better financial visibility.
Can I customize the charts, add new KPIs, or change the color scheme?
Yes. You receive the complete .pbix source file and can modify any visual, add new report pages, create custom DAX measures, or update colors using Power BI’s built-in theme settings. No additional tools or coding required for most customizations.
Is this dashboard compatible with any type of landscaping data?
Yes. The dashboard uses generic field names (Service Type, Region, Client Type, Crew Leader) that you map to your own columns in Power Query. Whether your data comes from Excel, a CSV export, or a job management system, you can connect it to this template.
About the Author
Built by PK — Microsoft Certified Professional with 15+ years of Excel, Google Sheets, and Power BI experience. Founder of NextGenTemplates, reaching 300K+ subscribers across YouTube channels. Every template is hand-built and tested before release.
Conclusion
The Landscaping Dashboard in Power BI gives landscaping and lawn care businesses a clear, organized view of revenue, profitability, client value, regional performance, and crew operations — all in a single .pbix file with 5 interactive report pages. At a one-time cost of $17.99 with no subscription and no per-user fees, it delivers enterprise-grade analytics at a fraction of what SaaS tools charge.
Click here to Purchase the Landscaping Dashboard in Power BI
✅ Instant download · One-time payment · No subscription · Lifetime access
For step-by-step Power BI tutorials, visit Youtube.com/@PK-AnExcelExpert
📅 Last updated: May 2026