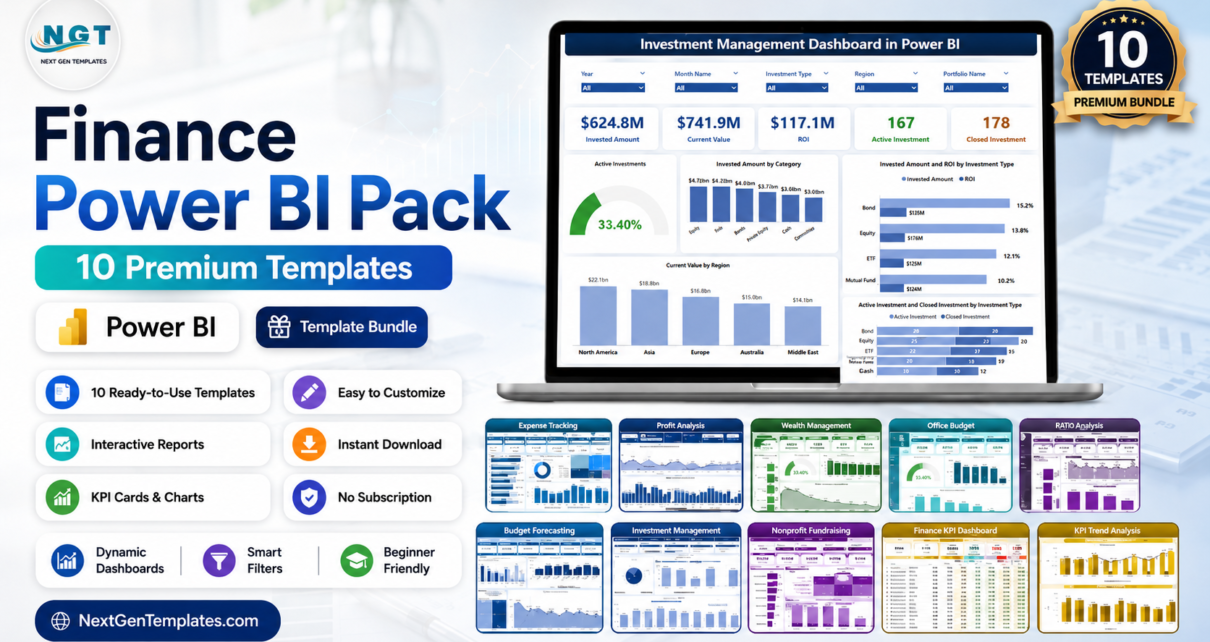
If you build finance reports in Power BI, you already know the pain: every new request means rebuilding measures, re-theming visuals and wiring up slicers from scratch. The Finance Power BI Pack removes that grind. It brings together 10 premium Power BI dashboards that cover the whole finance function — from expense tracking and budgeting to revenue, profit, investments and fundraising. Buying the dashboards individually costs $173.90; as a bundle you pay just $96.99 and save 44% ($76.91). Browse the full range in our Dashboard templates collection.
Get All 10 Finance Power BI Dashboards in One Pack
Was $173.90 → Now $96.99
Save 44% ($76.91)
Key Features of the Finance Power BI Pack
The Finance Power BI Pack is designed to be a complete, plug-and-play finance reporting stack. Every template is a native Power BI (.pbix) file with a consistent visual language, so a report built for expenses feels familiar when you open the one for investments. You get interactive slicers, drill-downs and KPI cards throughout, along with ready-made DAX measures for the metrics finance teams actually report on — variance, margin, utilisation, returns and growth.
Because the dashboards share a design system, they are easy to co-brand and roll out across a team. Replace the sample data with your own through Power Query and every visual, card and What-if parameter refreshes automatically — no formula surgery required. That makes the pack equally useful as a finished deliverable, a fast starting point for client work, or a learning resource for analysts levelling up their Power BI skills.
What’s Included in the Finance Power BI Pack
Expense Tracking Dashboard in Power BI
Analyze spending across departments, categories and vendors with current-vs-prior-year variance and full drill-down. Ideal for controllers who need to explain where the money actually went. View the Expense Tracking Dashboard in Power BI →
Revenue Analysis Dashboard in Power BI
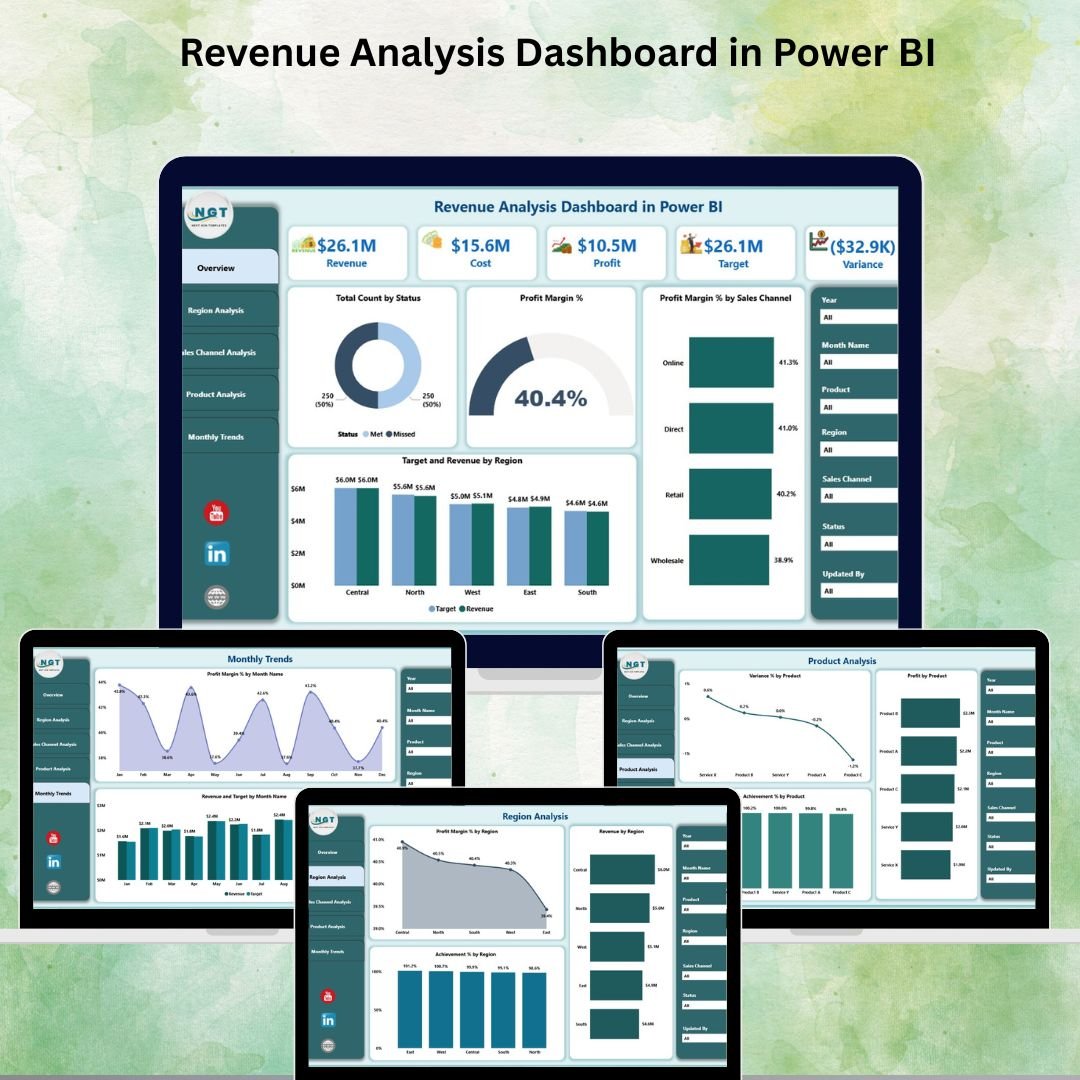
Five pages of revenue intelligence with KPI cards for revenue, margin percentage and target achievement, plus trend and product/region breakdowns. View the Revenue Analysis Dashboard in Power BI →
Profit Analysis Dashboard using What-if Parameter in Power BI
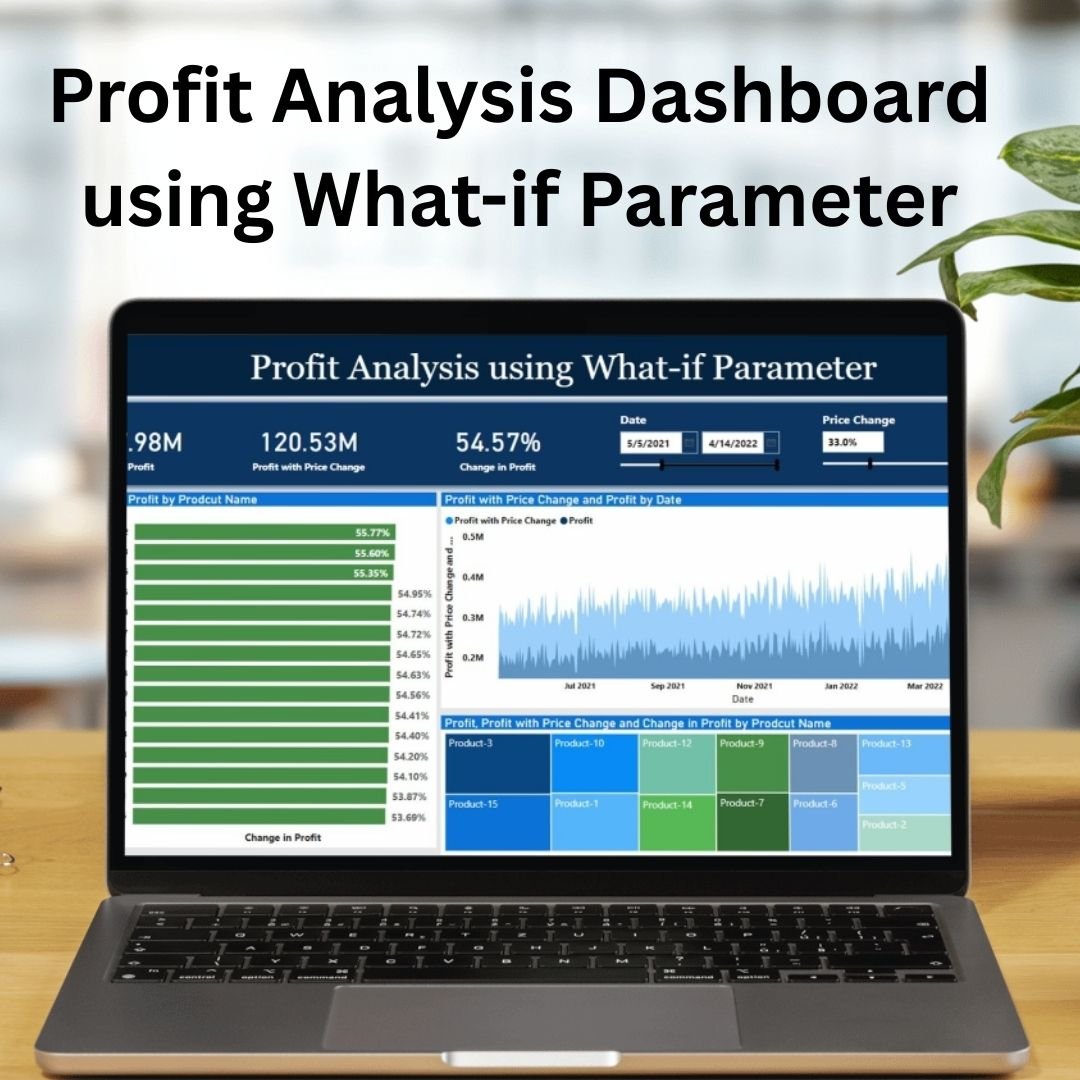
Model profit scenarios live using What-if parameters for price, cost and volume so you can answer ‘what happens if…’ questions in the room, not the day after. View the Profit Analysis Dashboard using What-if Parameter in Power BI →
Wealth Management Dashboard in Power BI

Track client portfolios, assets under management, asset allocation and returns in one advisor-ready view built for wealth and private-client teams. View the Wealth Management Dashboard in Power BI →
Office Budget Utilization Dashboard in Power BI
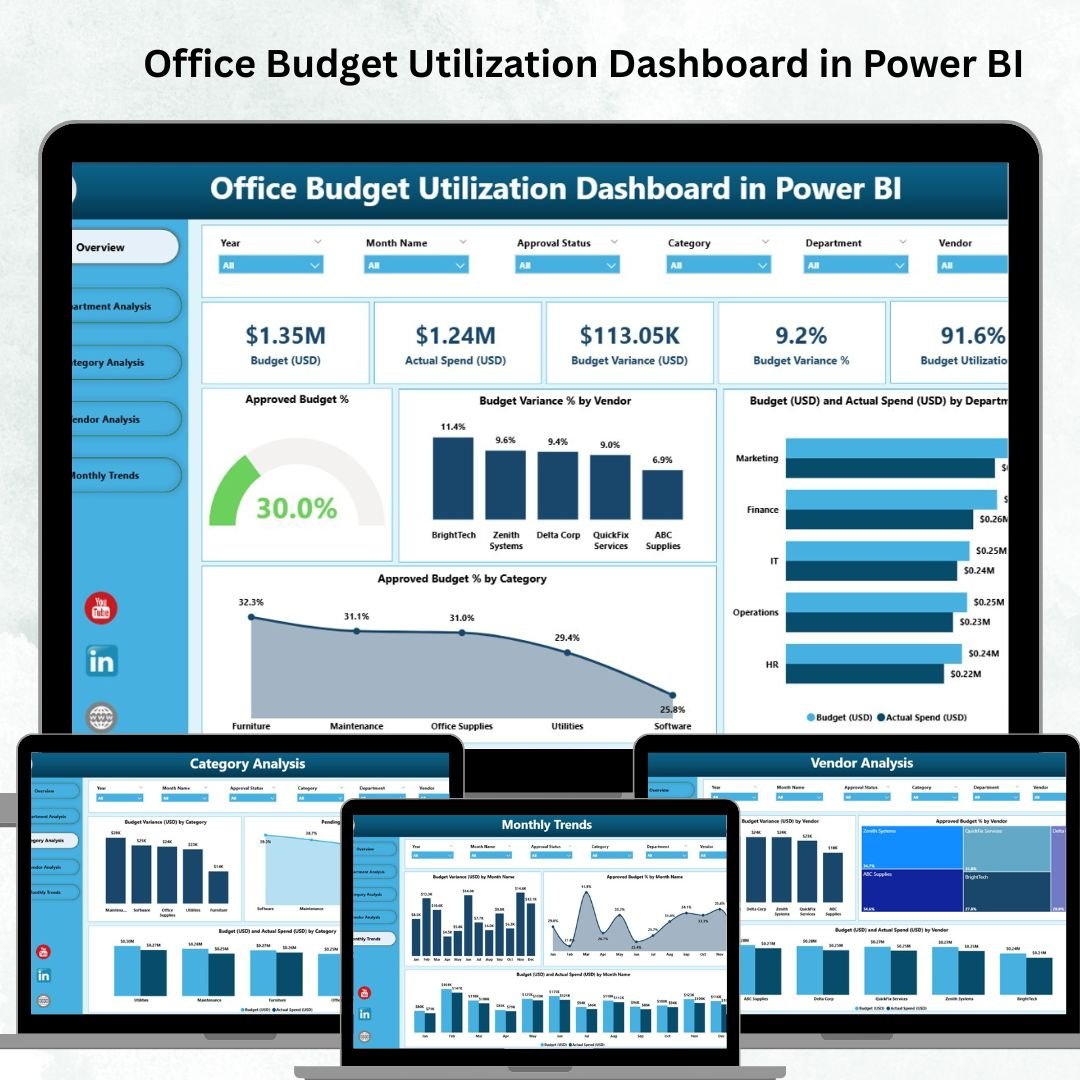
Monitor office budget versus actual spend by department, cost centre and category, with utilisation percentages that flag over- and under-spend early. View the Office Budget Utilization Dashboard in Power BI →
Real Estate Investment Trusts (REITs) Dashboard in Power BI
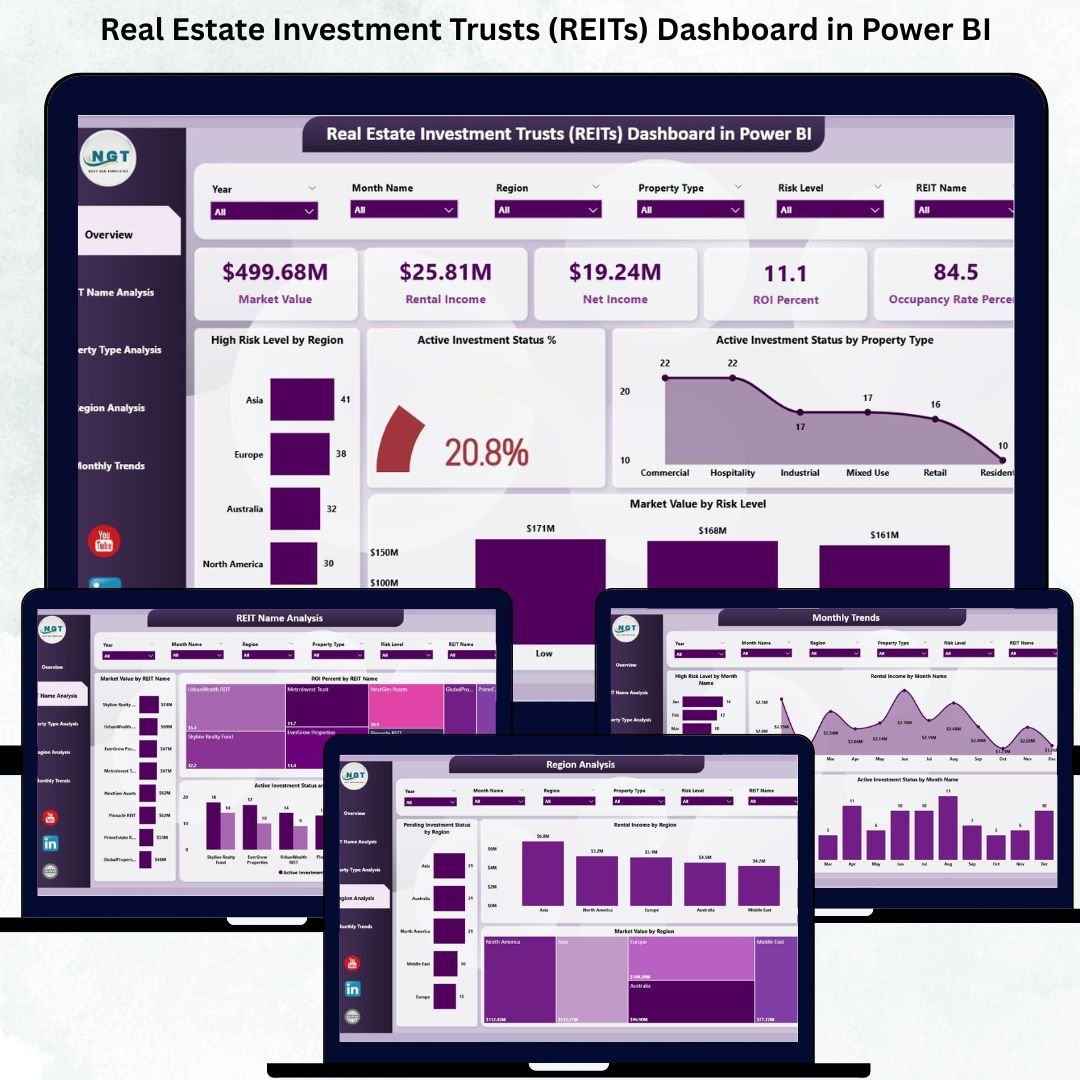
Analyse REIT performance including occupancy, net operating income, funds from operations and dividend yields across a property portfolio. View the Real Estate Investment Trusts (REITs) Dashboard in Power BI →
Budget Forecasting Dashboard in Power BI
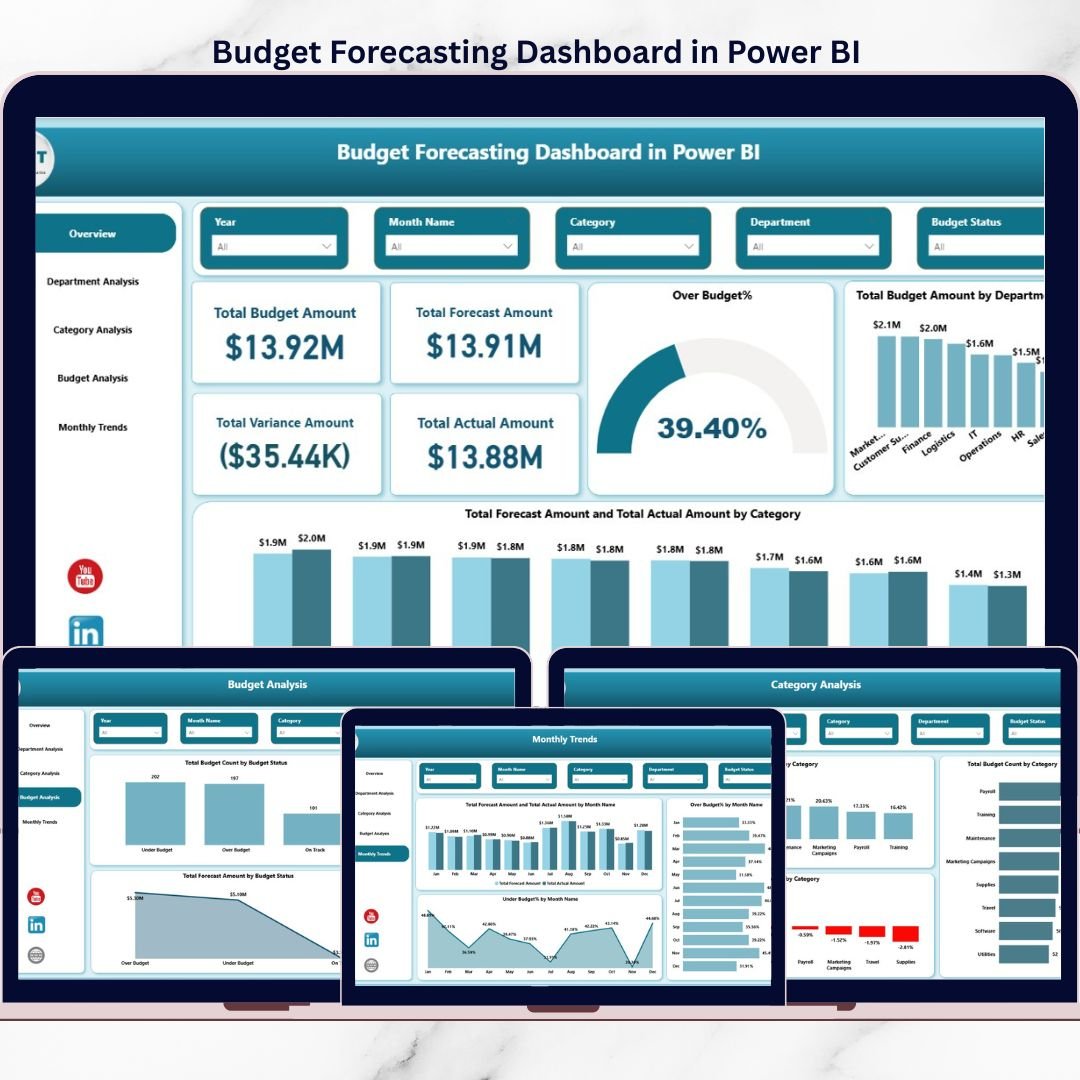
Project budgets forward with trend-based forecasts and live variance tracking so finance teams can course-correct before quarter end. View the Budget Forecasting Dashboard in Power BI →
Investment Management Dashboard in Power BI
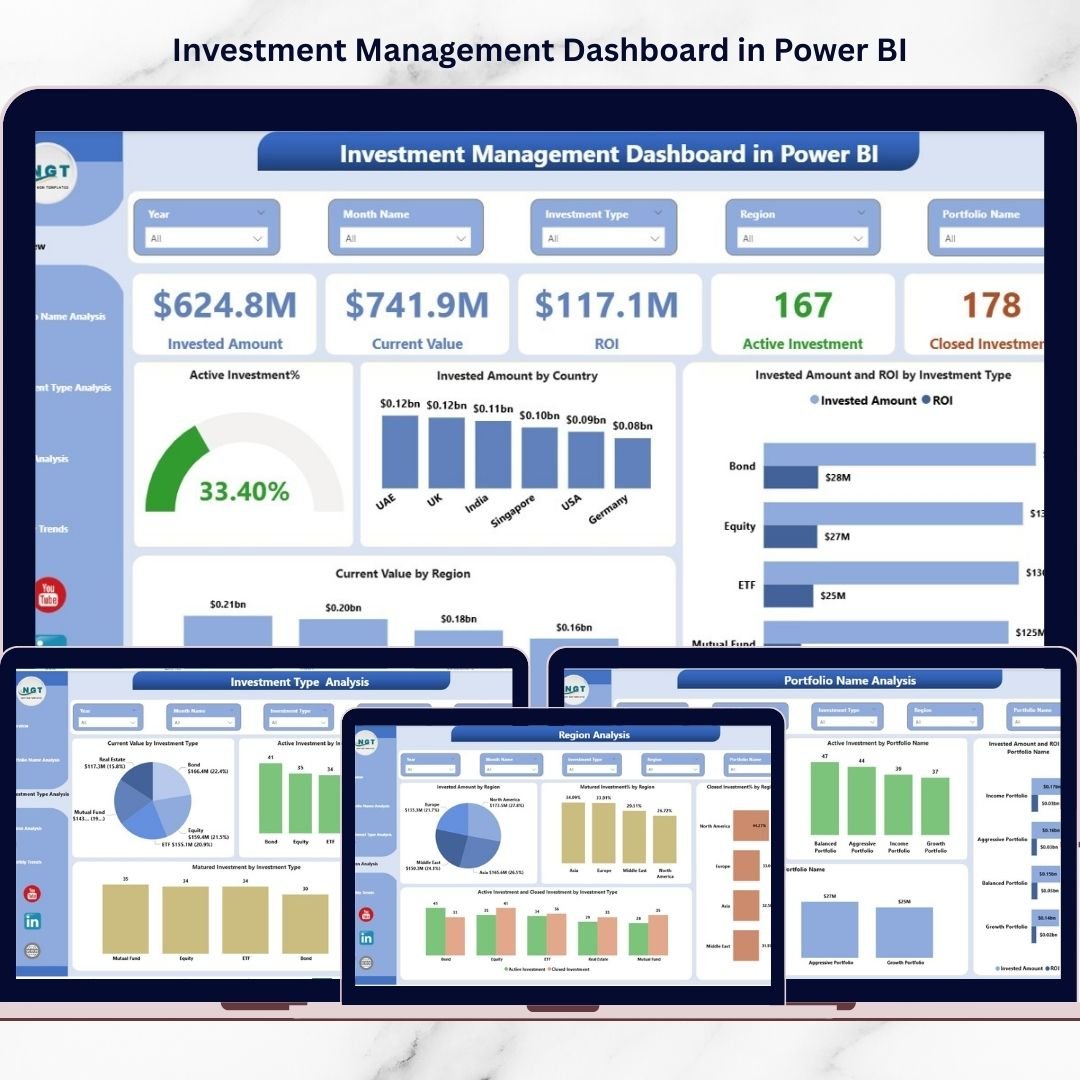
Track holdings, returns, risk and asset allocation across an investment book, with performance attribution for portfolio managers. View the Investment Management Dashboard in Power BI →
Nonprofit Fundraising Dashboard in Power BI
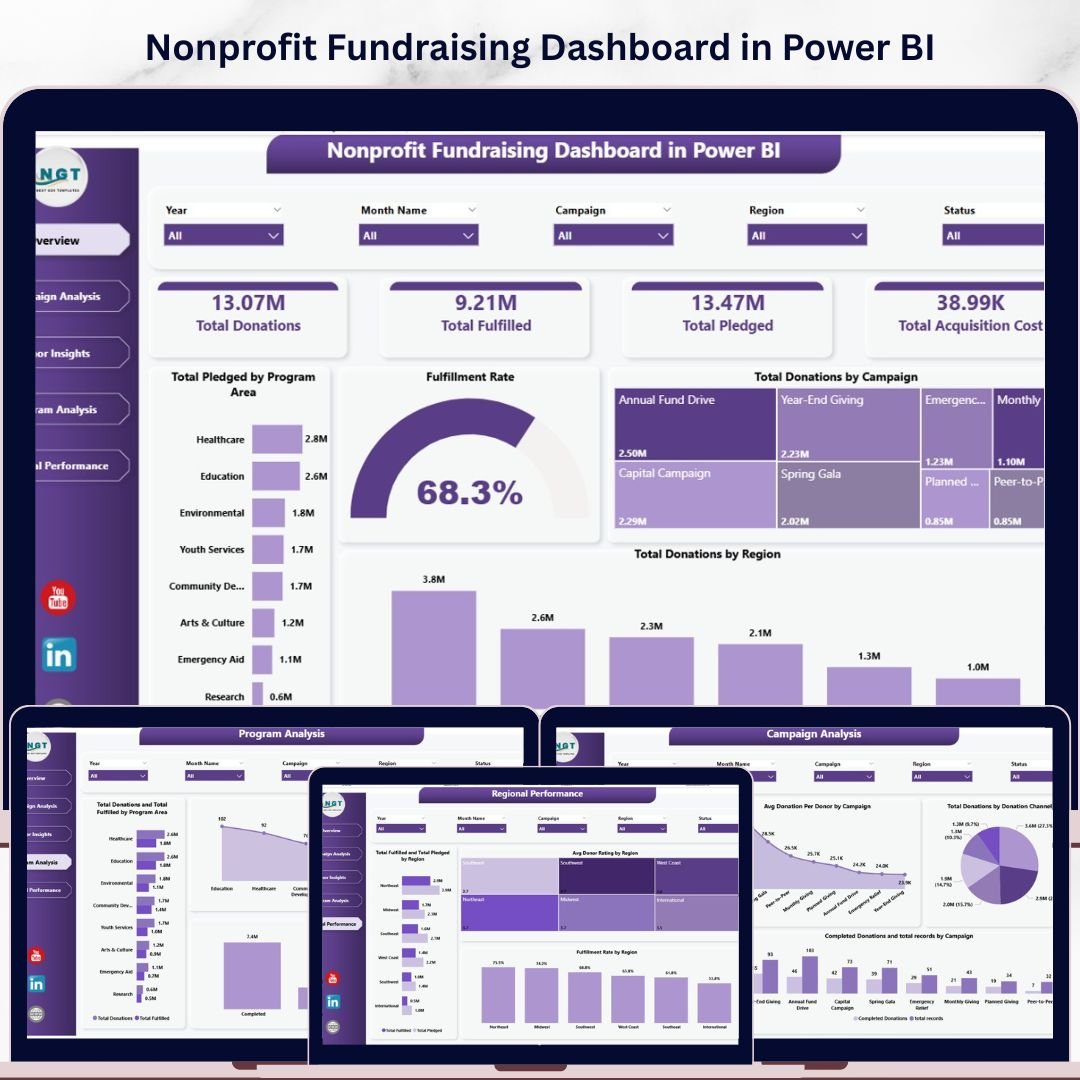
Monitor donations, campaigns, donor retention and fundraising goals in real time — purpose-built for nonprofit finance and development teams. View the Nonprofit Fundraising Dashboard in Power BI →
Finance KPI Dashboard in Power BI

A single executive scorecard for the headline finance KPIs — revenue, profit, cash and margins — perfect as a board-ready one-pager. View the Finance KPI Dashboard in Power BI →
Smart Comparison — Individual vs Bundle
Here is exactly how the numbers stack up when you buy the 10 dashboards together instead of one at a time:
| # | Dashboard | Platform | Individual Price |
|---|---|---|---|
| 1 | Expense Tracking Dashboard in Power BI | Power BI | $17.99 |
| 2 | Revenue Analysis Dashboard in Power BI | Power BI | $17.99 |
| 3 | Profit Analysis Dashboard using What-if Parameter in Power BI | Power BI | $17.99 |
| 4 | Wealth Management Dashboard in Power BI | Power BI | $17.99 |
| 5 | Office Budget Utilization Dashboard in Power BI | Power BI | $17.99 |
| 6 | Real Estate Investment Trusts (REITs) Dashboard in Power BI | Power BI | $17.99 |
| 7 | Budget Forecasting Dashboard in Power BI | Power BI | $17.99 |
| 8 | Investment Management Dashboard in Power BI | Power BI | $17.99 |
| 9 | Nonprofit Fundraising Dashboard in Power BI | Power BI | $17.99 |
| 10 | Finance KPI Dashboard in Power BI | Power BI | $11.99 |
| Individual Total | $173.90 | ||
| Finance Power BI Pack Price | $96.99 (Save 44%) | ||
Advantages of Buying the Bundle
The most obvious advantage is price: a 44% saving of $76.91 versus buying the same dashboards individually. But the strategic value goes further. A single, coherent pack means your expense, budget, revenue and investment reports all speak the same visual language, which makes executive reporting cleaner and onboarding faster. Instead of stitching together templates from different sources, you get one finance analytics library with a shared look, shared logic and shared data-modelling patterns.
For consultants and BI developers, the pack is a productivity multiplier — a ready inventory of finance dashboards you can tailor to a client in hours rather than days. For in-house teams, it is an instant upgrade to the standard of finance reporting without a build project.
Best Practices for Deploying the Pack
Start by opening each .pbix in Power BI Desktop and reviewing the sample data model so you understand the tables and relationships. Map your own data into those same table shapes through Power Query rather than rebuilding the model — this keeps every downstream measure and visual working. Standardise your date table and currency formatting across all 10 reports so cross-report comparisons stay consistent. Finally, publish the finished reports to a shared Power BI workspace and use app audiences to control who sees what, so finance, leadership and department heads each get the right view.
Explore More Templates
Looking for more? Browse the full Dashboard template collection and the Power BI bundles on NextGenTemplates, or head straight to the Finance Power BI Pack to get all 10 dashboards in one download.
Frequently Asked Questions
What is included in the Finance Power BI Pack?
The pack includes 10 ready-to-use Power BI dashboard templates in native .pbix format: Expense Tracking, Revenue Analysis, Profit Analysis (What-if), Wealth Management, Office Budget Utilization, REITs, Budget Forecasting, Investment Management, Nonprofit Fundraising and a Finance KPI dashboard.
How much do I save compared with buying the dashboards individually?
Bought separately the 10 dashboards cost $173.90. The bundle is $96.99, so you save $76.91 — a 44% discount.
Do I need Power BI Pro to use these templates?
No. You can open, edit and refresh every template in the free Power BI Desktop. A Pro or Premium licence is only needed if you want to publish and share reports through the Power BI Service.
Can I use my own data?
Yes. Each dashboard ships with sample data you replace via Power Query. Once your tables are mapped, all KPI cards, charts and What-if parameters refresh automatically.
Is this a one-time purchase or a subscription?
It is a one-time purchase. You download the templates and own them outright — there are no recurring fees, in keeping with the NextGenTemplates anti-subscription approach.
Who is the Finance Power BI Pack best for?
Finance analysts, FP&A teams, BI developers, CFOs and controllers, investment and wealth advisors, budget owners and nonprofit finance teams who want a complete Power BI reporting stack without building from scratch.
Conclusion
The Finance Power BI Pack gives finance analysts and BI developers a complete Power BI reporting stack — 10 polished dashboards spanning expenses, budgets, revenue, profit, investments, wealth, REITs and fundraising — for a single price of $96.99, a 44% saving on the $173.90 individual total. It is the fastest way to standardise finance reporting without building from scratch.
Get All 10 Finance Power BI Dashboards in One Pack
Was $173.90 → Now $96.99
Save 44% ($76.91)
Visit our YouTube channel for step-by-step video tutorials
👉 Youtube.com/@PKAnExcelExpert