Part of the free Module 10: Pivot Tables · Lesson 11 of 20 · Full Excel course
Updated on 5 September 2026 · Works in Excel 365, 2021, 2019 and 2016 (timelines need Excel 2013 or later).
A timeline in a pivot table is a date-only slicer: a horizontal band you click or drag to filter the report by days, months, quarters or years. Insert it from PivotTable Analyze > Filter > Insert Timeline, tick the date field and click OK. This lesson shows how to insert a timeline, change its level, select a range, connect it to several pivot tables and charts, and fix the greyed-out button.
What a timeline does and when to use it
A slicer lists every item as a button, which is useless for a date field with hundreds of individual days. A timeline presents the same dates as a continuous band grouped at the level you choose. Click one month to filter to that month, or drag the selection handles to cover a quarter, a half-year or any custom span. The pivot table, and every pivot chart built on it, updates at once.
Timelines need a genuine date column in the source data. They were introduced in Excel 2013 and work in Excel 2016, 2019, 2021 and 365, on Windows and Mac. Excel for the web displays and uses an existing timeline but cannot insert a new one.
| Control | Field types | Best for | Range selection | Minimum version |
|---|---|---|---|---|
| Report filter (Filters area) | Any | One field with a few items, printed reports | Tick boxes in a list | All |
| Slicer | Any | Categories such as Product or Supervisor | Click, Ctrl-click or multi-select button | 2010 |
| Timeline | Date only | Periods: months, quarters, years | Click or drag a continuous span | 2013 |
How to insert a timeline in a pivot table
- Click anywhere inside the pivot table.
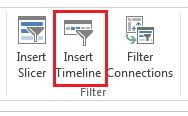
- On the PivotTable Analyze tab (called Analyze in Excel 2016 and 2019) click Insert Timeline in the Filter group. It is also available at Insert > Filters > Timeline.
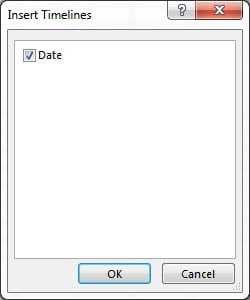
- The Insert Timelines dialog lists every date field in the data source. The practice file has one, Date. Tick it and click OK. If your date column is missing from this list, it is stored as text and must be converted first.
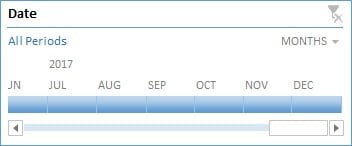
- The timeline appears on the worksheet, grouped by Months by default, with year labels above the month blocks and a selection label showing the current filter (All Periods until you click).
Change the time level and select a range
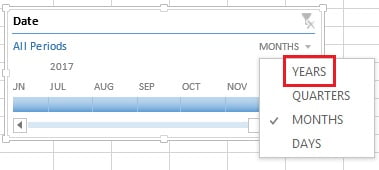
- Click the drop-down at the top right of the timeline and choose Years, Quarters, Months or Days.
- Click a year, quarter or month block to filter the pivot table to that period.
- Drag the handle at either end of the highlighted band to extend the selection across several periods. The selection label confirms the range, for example Jan – Mar 2018.
- Click a block at one level, then switch to a finer level: the selection is kept and you can trim it, for example choose Q1 and then drop February at the Months level by dragging the handle.
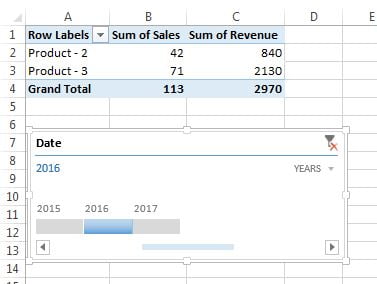
Connect one timeline to several pivot tables and charts
- Select the timeline and open the Timeline tab, then click Report Connections (or right-click the timeline and choose Report Connections).
- Tick every pivot table that should follow the timeline and click OK.
- Pivot charts follow their pivot tables automatically, so one timeline can drive a whole dashboard sheet.
Only pivot tables that share the same pivot cache appear in the list. Two pivot tables built from the same range with Insert > PivotTable share a cache; a report created through the legacy wizard with its own cache, or from a different data source, will not be listed. If a pivot table is missing, rebuild it from the same source. The same rule applies to slicers, covered in Slicers in a Pivot Table.
Clear, format and lock the timeline
- Clear the filter with the funnel icon at the top right of the timeline, or press Alt + C while the timeline is selected.
- Show or hide parts: on the Timeline tab untick Header, Scrollbar, Selection Label or Time Level to simplify the control for a dashboard.
- Rename the caption: Timeline > Timeline Caption changes the word Date to something like Select period.
- Style it with the Timeline Styles gallery, or create a custom style that matches your dashboard colours. Custom styles are covered in Pivot Table, Slicer and Timeline Styles.
- Lock its position: right-click, choose Size and Properties, open Properties and pick Don’t move or size with cells. Tick Locked and protect the sheet with the option to use PivotTable reports allowed.
- Scroll with the bar at the bottom when the data spans many years, or set the level to Years so the whole span fits.
Worked example: quarter-on-quarter revenue with one timeline
Open the practice file Pivot-Table.xlsx and build a pivot table with Product in Rows and Revenue in Values. Insert a timeline on Date, set the level to Quarters and click Q1. The pivot table shows only January to March.
| Product | Revenue, Q1 selected | Revenue, Q1 to Q2 dragged |
|---|---|---|
| Product A | 131,700 | 268,900 |
| Product B | 81,300 | 170,400 |
| Product C | 175,400 | 352,100 |
| Grand Total | 388,400 | 791,400 |
Drag the right handle from Q1 to Q2 and the second column appears. Now add a pivot chart (PivotTable Analyze > PivotChart, Clustered Column) beside the report: it redraws with every timeline click, with no extra connection needed. To compare two years, switch the level to Years and drag across both.
Tips and common mistakes
- Insert Timeline greyed out. The source has no real date column. Convert text dates with Text to Columns or DATEVALUE, refresh the pivot table, and try again.
- Timeline and grouped dates are independent. You can group the Rows area by Months and still filter with the timeline at Quarters; see Group Dates in a Pivot Table.
- Calendar years only. A timeline cannot follow a fiscal year. Add a Fiscal Year or Fiscal Quarter column to the source and use a slicer on it instead.
- One control per field. A report filter and a timeline on the same Date field fight each other; keep one.
- Blank dates are excluded. Rows with an empty Date cell disappear as soon as any period is selected. Fill or remove them.
- Refresh does not clear the selection. After adding new months to the source, widen the selection or clear it, or the new data stays hidden.
- Copying the sheet duplicates the timeline but keeps it connected to the original pivot table. Reconnect it through Report Connections.
Errors and how to fix them
| Problem | Cause | Fix |
|---|---|---|
| Insert Timeline is disabled | No date field in the pivot cache | Convert the column to real dates and refresh |
| Pivot table not listed in Report Connections | Different pivot cache or data source | Rebuild the pivot table from the same range or Table |
| Timeline shows years that do not exist in the data | A typo such as 2108 in one row | Sort the source by Date and correct the outlier |
| Timeline moves when rows are inserted | Default object property Move and size with cells | Size and Properties > Properties > Don’t move or size with cells |
| Selection resets to All Periods | The date field was removed from the cache or the source was changed | Refresh and reselect the period |
Practice exercise
- Insert a timeline on Date and filter the practice pivot table to a single month, then to a full quarter by dragging.
- Switch the level to Years, select the whole span and check the Grand Total matches the unfiltered report.
- Build a second pivot table (Supervisor Name in Rows, Sales in Values) from the same data and connect the timeline to both through Report Connections.
- Add a pivot chart to the first report and confirm it changes when you click a quarter.
- Hide the Scrollbar and Time Level, rename the caption to Select period, and apply a dark timeline style.
Key takeaways
- A timeline filters a pivot table by date with a click or a drag; insert it from PivotTable Analyze > Insert Timeline.
- Switch between Years, Quarters, Months and Days from the drop-down at the top right.
- Report Connections lets one timeline control several pivot tables that share a cache; charts follow automatically.
- Insert Timeline is greyed out when the source has no genuine date column.
- Timelines follow calendar years; use a slicer on a fiscal column for fiscal periods.
- Alt + C clears the selection; the Timeline tab controls header, label, scrollbar and style.
Related lessons
- Pivot Table course: all 20 lessons
- Slicers in a pivot table
- Group dates by month, quarter and year
- Pivot charts
- Excel Dashboard course
- SUMIFS: date-range totals without a pivot table
- Microsoft Support: Use slicers to filter data
Frequently asked questions
Why is Insert Timeline greyed out in my pivot table?
The data source has no column that Excel recognises as dates, usually because the dates were imported as text. Convert the column with Text to Columns (choose Date as the format) or a DATEVALUE helper column, refresh the pivot table, and the Insert Timeline command becomes available.
What is the difference between a slicer and a timeline?
A slicer shows every item of any field as a button and suits categories such as Product. A timeline works only with date fields and presents them as a draggable band grouped by years, quarters, months or days, so you can select a continuous period without hundreds of buttons.
Can one timeline filter several pivot tables?
Yes. Select the timeline, open the Timeline tab and click Report Connections, then tick each pivot table. The pivot tables must share the same pivot cache, which they do when they are built from the same range or Table. Connected pivot charts update at the same time.
Can a timeline use a fiscal year?
No. A timeline groups by calendar years, quarters, months and days only. For a fiscal calendar add Fiscal Year and Fiscal Quarter columns to the source data with a formula, refresh the pivot table, and insert a slicer on those columns instead of a timeline.
Does a timeline work in Excel for Mac and Excel online?
Excel for Mac 2016 and later can insert and use timelines exactly as Windows does. Excel for the web can display and click an existing timeline in a workbook, but it cannot insert a new one; add it in the desktop application first and the browser will honour it.
Want the finished version? Ready-made Excel dashboards, trackers and VBA systems are available at NextGenTemplates.com.