Airbnb Host Dashboard in Power BI is a professional ready-to-use analytics template designed specifically for Airbnb hosts and property managers who want to monitor their rental business performance using interactive Power BI visuals. Whether you operate a single listing or manage multiple properties across various locations, this dashboard converts your raw booking and revenue data into clear, actionable insights that drive smarter hosting decisions.
The short-term rental market has grown tremendously with platforms like Airbnb, Vrbo, and Booking.com transforming how property owners generate income. However, tracking dozens of performance metrics including total revenue, host payouts, guest ratings, nightly rates, and booking trends can be overwhelming without a centralized analytics tool. The Airbnb Host Dashboard in Power BI solves this challenge by consolidating all your hosting data into one dynamic reporting system powered by Microsoft Power BI.
This dashboard includes 5 interactive analytical pages covering Overview, Property Analysis, Booking Trends, Location Insights, and Revenue Analysis. Each page delivers focused insights using dynamic visuals, KPI cards, and slicers. Simply connect your data source, refresh the dataset, and every chart and KPI updates automatically.
Key Features of Airbnb Host Dashboard in Power BI
The Airbnb Host Dashboard in Power BI is packed with powerful analytics features designed to give you complete visibility into your hosting business. Here are the highlights:
- 5 Interactive Dashboard Pages — Analyze performance across Overview, Property Analysis, Booking Trends, Location Insights, and Revenue Analysis with dynamic Power BI visuals.
- Dynamic KPI Cards — Track Total Revenue, Total Bookings, Avg Guest Rating, Total Host Payout, and Avg Nightly Rate at a glance.
- Interactive Slicers and Filters — Filter data instantly by property type, location, booking source, superhost status, month, year, and booking status.
- Property-Level Performance — Compare revenue, guest ratings, and total nights across all your properties.
- Location-Based Insights — Analyze performance metrics across all your hosting locations.
- Revenue Breakdown — Understand revenue distribution by superhost status, booking source, and instant book availability.
- Auto-Refreshing Visuals — All charts update automatically when you refresh your data source.
- DAX-Powered Calculations — Built-in DAX measures ensure accurate KPI tracking across every page.
Dashboard Pages Explanation
The Airbnb Host Dashboard in Power BI contains 5 analytical pages, each designed to analyze a different aspect of your Airbnb hosting business.
1. Overview Page — Main Airbnb Analytics Dashboard
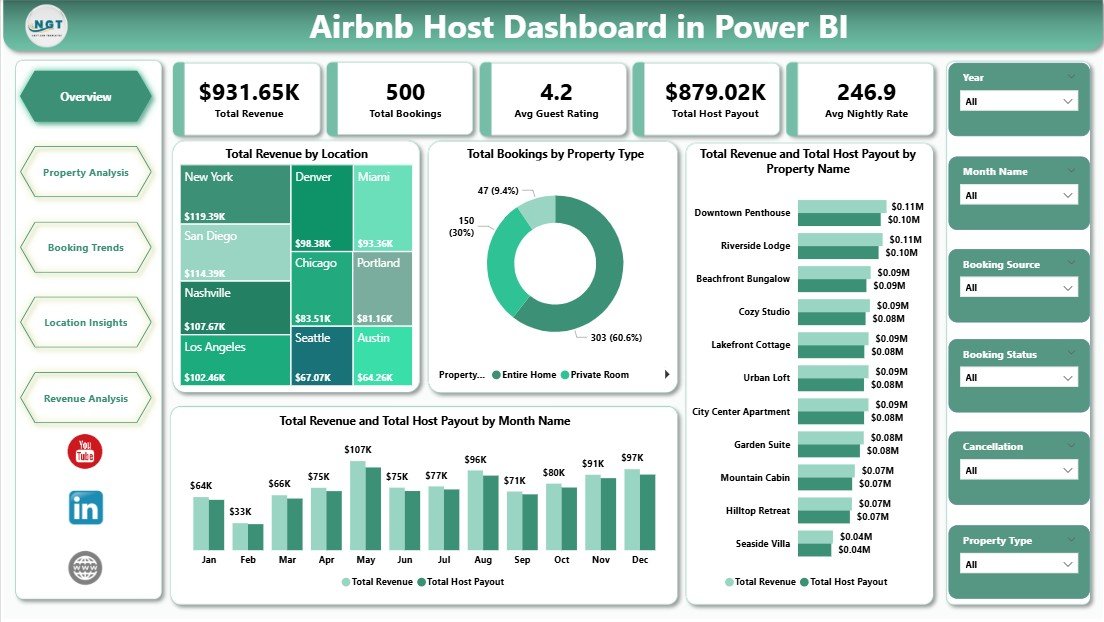
Overview PageThe Overview Page provides a high-level snapshot of your entire Airbnb hosting business. At the top, it displays 5 KPI cards: Total Revenue, Total Bookings, Avg Guest Rating, Total Host Payout, and Avg Nightly Rate. These cards give you an instant view of your business health.
The page includes interactive charts that provide deeper analysis. Total Revenue by Location helps you compare earnings across different cities and neighborhoods, revealing which areas generate the most income. Total Bookings by Property Type shows which accommodation categories such as apartments, houses, or shared rooms attract the most reservations. Total Revenue and Total Host Payout by Property Name lets you evaluate profitability at the individual property level, making it easy to spot underperformers. Total Revenue and Total Host Payout by Month Name highlights seasonal revenue patterns throughout the year, helping you plan pricing strategies. Multiple slicers allow you to filter the entire dashboard instantly.
2. Property Analysis Page
 Property Analysis
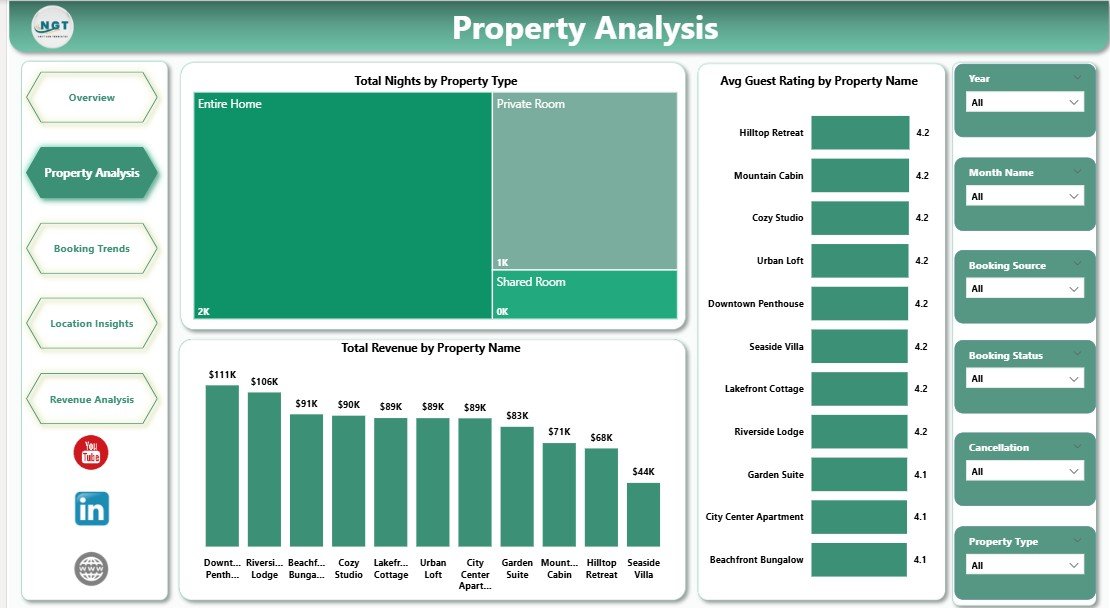
The Property Analysis page focuses on property-level performance metrics to help you understand which listings perform best. Total Nights by Property Type shows occupancy distribution across accommodation categories, revealing which types attract the longest stays. Avg Guest Rating by Property Name helps you identify properties that deliver the best guest experience and those needing improvement. Total Revenue by Property Name ranks your properties by income generation, making portfolio optimization straightforward.
3. Booking Trends Page
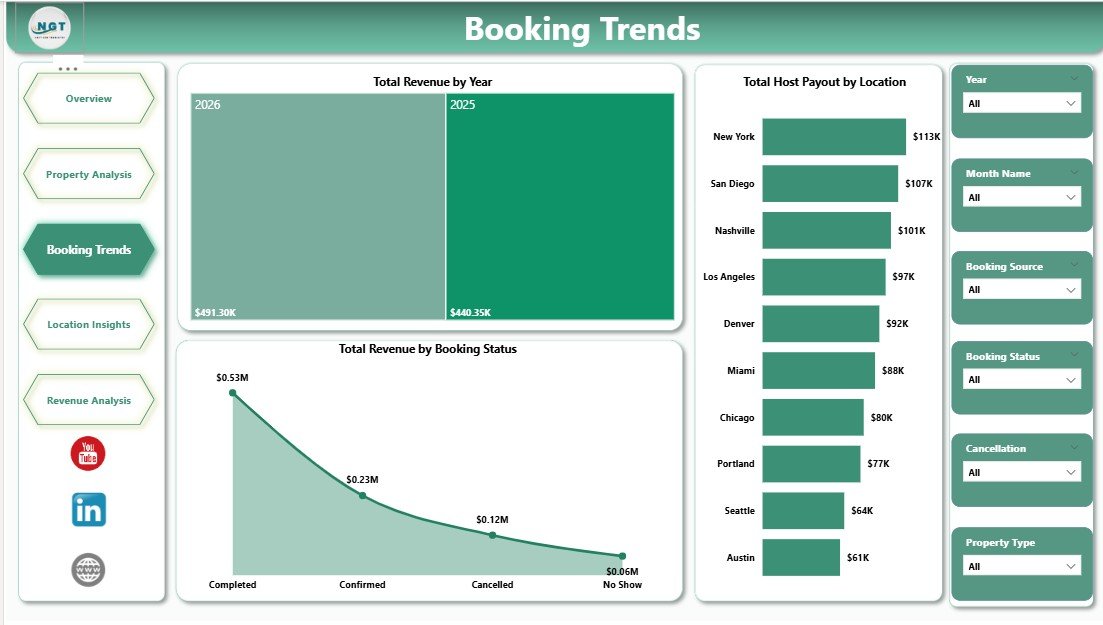 Booking Trends
The Booking Trends page analyzes reservation patterns over time. Total Revenue by Year tracks long-term business growth and helps you evaluate year-over-year performance. Total Host Payout by Location compares payouts across different areas to identify your most profitable hosting markets. Total Revenue by Booking Status helps you understand how confirmed, cancelled, and pending bookings impact your bottom line and plan accordingly.
4. Location Insights Page
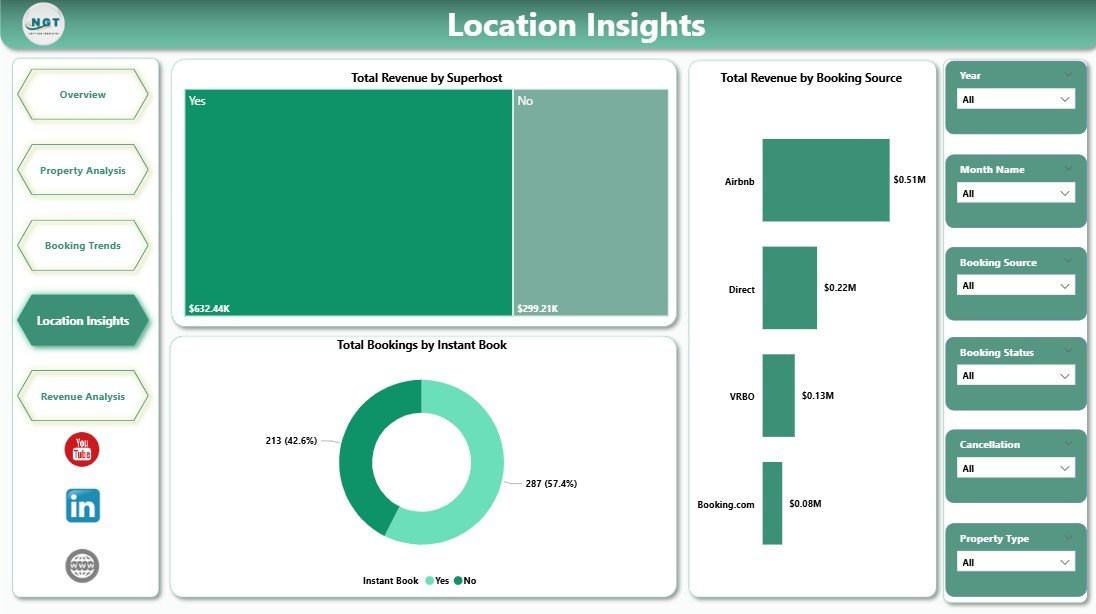 Location Insights
The Location Insights page delivers geographic performance analytics. Total Revenue by Superhost compares earnings between superhost and regular host listings, helping you understand the financial impact of superhost status. Total Revenue by Booking Source identifies which platforms and channels drive the most revenue. Total Bookings by Instant Book evaluates the impact of instant booking availability on reservation volume.
5. Revenue Analysis Page
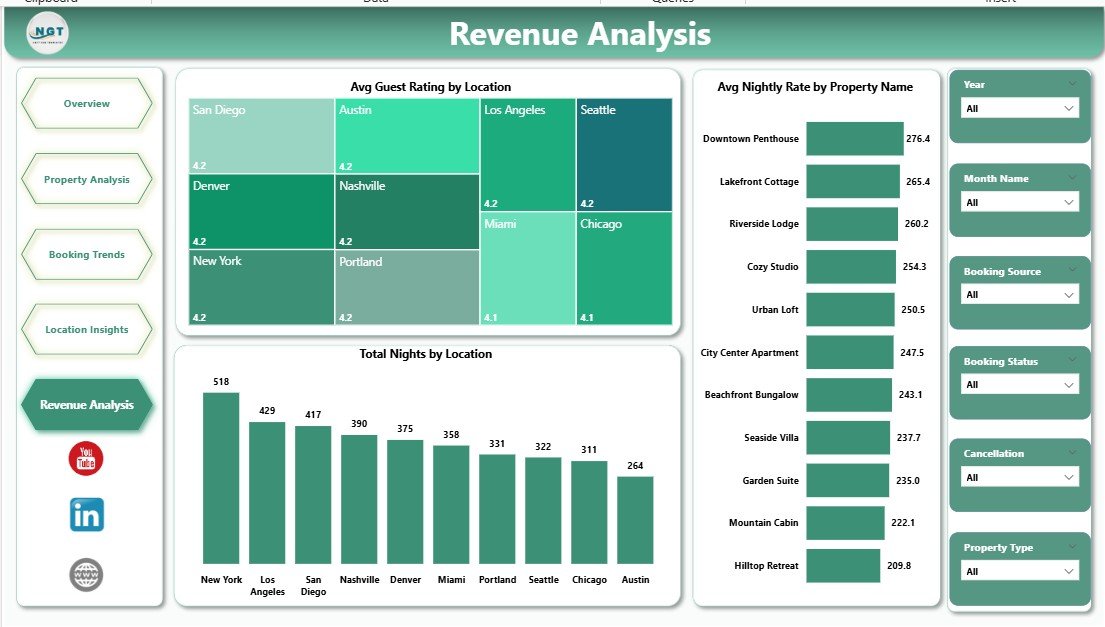 Revenue Analysis
The Revenue Analysis page breaks down financial performance with deep analytical visuals. Avg Guest Rating by Location helps you understand guest satisfaction trends across areas. Avg Nightly Rate by Property Name reveals pricing performance at the property level, helping you optimize your rate strategy. Total Nights by Location shows occupancy distribution across hosting locations to identify demand hotspots.
Advantages of Airbnb Host Dashboard in Power BI
This Power BI dashboard offers several advantages for Airbnb hosts and property managers. First, it provides a centralized view of all hosting metrics across multiple properties and locations in one place. Second, the interactive slicers allow you to drill down into specific segments instantly without manual data filtering. Third, DAX-powered calculations ensure that all KPIs and metrics are computed accurately and consistently. Fourth, the dashboard supports large datasets that would slow down traditional Excel-based solutions, making it ideal for hosts managing dozens or hundreds of listings. Finally, Power BI’s native support for scheduled data refreshes means your dashboard can stay updated automatically when connected to cloud data sources.
Opportunities for Improvement
While the dashboard covers comprehensive hosting analytics, there are areas where you could extend its functionality. Adding predictive analytics using Power BI’s built-in forecasting could help predict future booking trends and revenue. Integrating competitive pricing data from market sources would enable rate optimization based on local market conditions. Including a review sentiment analysis page could help track guest feedback themes over time. Additionally, connecting the dashboard to live Airbnb API data would enable real-time performance monitoring instead of periodic manual updates.
Best Practices
To get the most out of your Airbnb Host Dashboard in Power BI, follow these best practices. Update your data regularly — ideally weekly or after each booking cycle — to ensure your analytics reflect current performance. Use the slicers to compare time periods such as month-over-month or year-over-year to identify trends. Pay special attention to the property-level metrics to identify underperforming listings that may need pricing adjustments or improved amenities. Monitor the Location Insights page to understand which geographic areas offer the best return on investment. Share your dashboard with team members or co-hosts using Power BI’s sharing features to enable collaborative decision-making.
Explore Relevant Templates
If you found this dashboard useful, explore these related templates from NextGenTemplates.com:
- Airbnb Host Dashboard in Excel — The Excel version with pivot-based interactive charts and slicers for hosts who prefer spreadsheet analytics.
- Airbnb-style Rentals Dashboard in Power BI — Advanced Power BI rental analytics with booking performance, host evaluation, and city-wise revenue analysis.
- Airbnb-style Rentals Dashboard in Excel — Comprehensive Excel dashboard for short-term rental booking, occupancy, and revenue analytics.
Browse our complete collection of Power BI Dashboard Templates.
Frequently Asked Questions
What KPIs does the Airbnb Host Dashboard in Power BI track?
The Airbnb Host Dashboard in Power BI tracks 5 key performance indicators including Total Revenue, Total Bookings, Avg Guest Rating, Total Host Payout, and Avg Nightly Rate. These KPIs provide a complete snapshot of your hosting business performance across all properties and locations.
Do I need advanced Power BI skills to use this dashboard?
No. Simply open the .pbix file in Power BI Desktop, replace the sample data with your own Airbnb records, and click Refresh. All charts and KPI cards update automatically without any manual DAX formula work.
Can I track multiple Airbnb properties with this dashboard?
Yes. The dashboard is designed to analyze multiple properties across different locations. Use the built-in slicers to filter by property name, property type, or location to compare performance across your entire portfolio.
How is this different from the Airbnb Host Dashboard in Excel?
The Power BI version offers more advanced visualization capabilities, larger dataset handling, and DAX-powered calculations. The Airbnb Host Dashboard in Excel is ideal for users who prefer working in Excel with pivot tables and slicers.
What is the best Power BI dashboard for Airbnb hosts?
The Airbnb Host Dashboard in Power BI from NextGenTemplates.com is one of the best options available. It includes 5 interactive analytical pages covering revenue, property performance, booking trends, location insights, and financial analysis with professional DAX-powered calculations.
Can I use this dashboard for Vrbo or other rental platforms?
Absolutely. While the dashboard uses Airbnb hosting terminology, the data structure works perfectly for any short-term rental platform including Vrbo, Booking.com, and similar services. Simply match your data columns to the existing format.
Conclusion
The Airbnb Host Dashboard in Power BI is a powerful analytics solution for Airbnb hosts and property managers who want data-driven insights into their rental business. With 5 interactive pages, 5 KPI cards, and comprehensive analysis across revenue, properties, bookings, locations, and financial metrics, this dashboard transforms raw hosting data into actionable intelligence.
Click here to Purchase the Airbnb Host Dashboard in Power BI
Visit our YouTube channel for step-by-step video tutorials: Youtube.com/@PK-AnExcelExpert