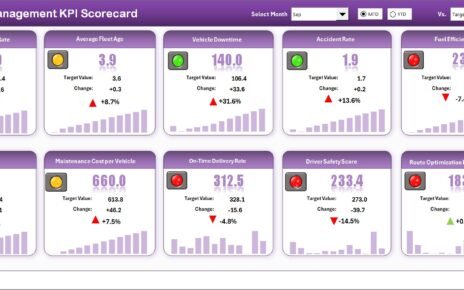
Fleet operations demand precision, cost control, and real-time visibility. However, many fleet managers still depend on scattered spreadsheets and manual
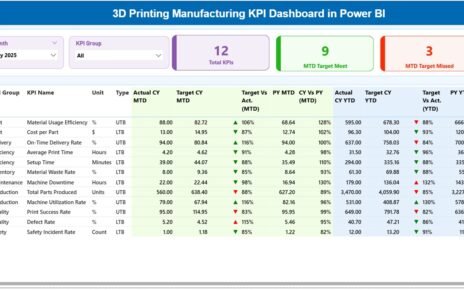
In today’s rapidly evolving manufacturing landscape, 3D printing (additive manufacturing) has changed how companies design, prototype, and produce components. Businesses
Employee onboarding is one of the most critical processes for any organization, as it sets the stage for new hires