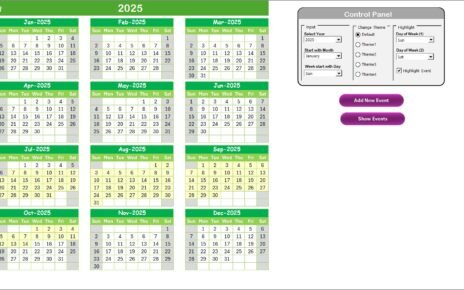
The Education Customer Service AI Implementation Calendar in Excel is a ready-to-use tool designed to help educational institutions manage customer
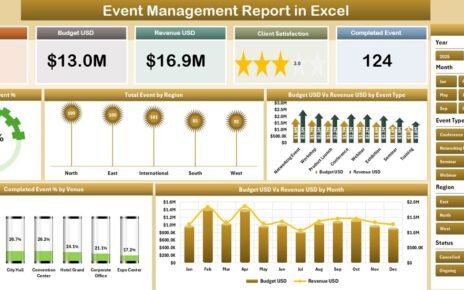
Tracking the performance of corporate events used to mean stitching together budget spreadsheets, attendance lists, and venue invoices into one
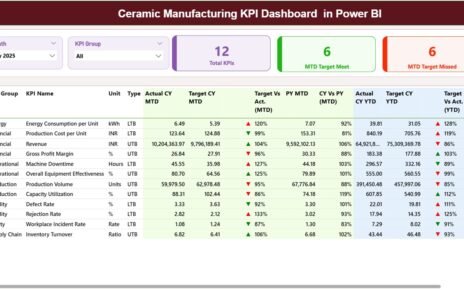
Ceramic manufacturing demands accuracy, speed, and cost control. Production targets must align with market demand. Kiln efficiency must remain stable.