Legal research plays a critical role in law firms, corporate legal departments, and compliance teams. However, tracking legal research performance often becomes difficult when data stays scattered across Excel files, emails, or static reports. As a result, leaders struggle to understand productivity, target achievement, and year-over-year performance.
That is exactly where a Legal Research KPI Dashboard in Power BI becomes an essential solution.
In this detailed article, you will learn what a Legal Research KPI Dashboard in Power BI is, how it works, its key features, advantages, best practices, and how legal teams can use it effectively to monitor MTD and YTD performance using interactive visuals.
Click to Purchases Legal Research KPI Dashboard in Power BI
What Is a Legal Research KPI Dashboard in Power BI?
A Legal Research KPI Dashboard in Power BI is an interactive reporting solution designed to track, analyze, and visualize key performance indicators related to legal research activities.
Instead of reviewing raw data manually, this dashboard converts Excel-based KPI data into dynamic visuals, trend analysis, and performance indicators. As a result, legal leaders can quickly identify strengths, gaps, and improvement areas.
Because Power BI supports interactivity and drill-through analysis, this dashboard delivers deeper insights than static reports.
Why Do Legal Teams Need KPI Dashboards?
Legal research output directly affects case quality, compliance accuracy, and turnaround time. Therefore, without KPI tracking, inefficiencies remain hidden.
A Legal Research KPI Dashboard in Power BI helps teams:
-
Monitor research productivity consistently
-
Compare actual results with targets
-
Track MTD and YTD performance
-
Measure improvement against previous years
-
Support data-driven legal decisions
When KPIs remain visible and interactive, legal operations become more controlled and predictable.
How Does a Legal Research KPI Dashboard in Power BI Work?
This dashboard works using three interactive pages in Power BI Desktop, supported by an Excel data source. Together, they create a complete legal research performance monitoring system.
Let us explore each dashboard page in detail.
Click to Purchases Legal Research KPI Dashboard in Power BI
Summary Page: Central KPI Performance Overview
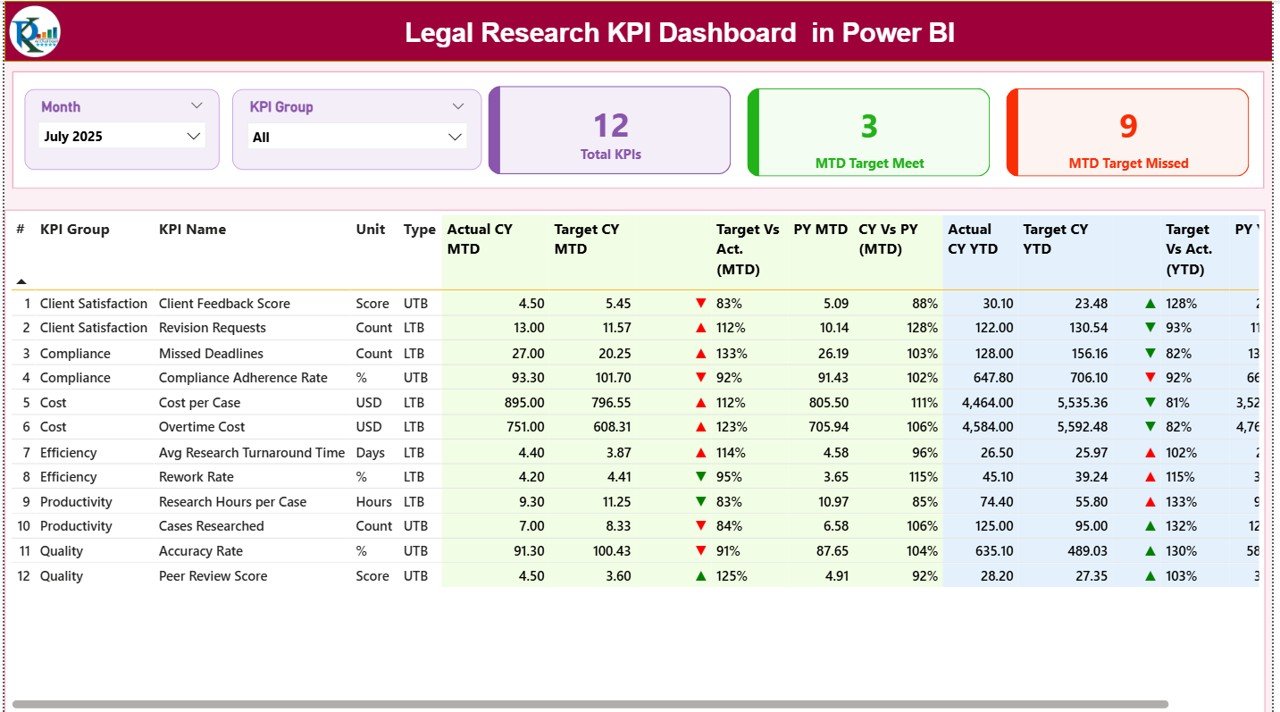
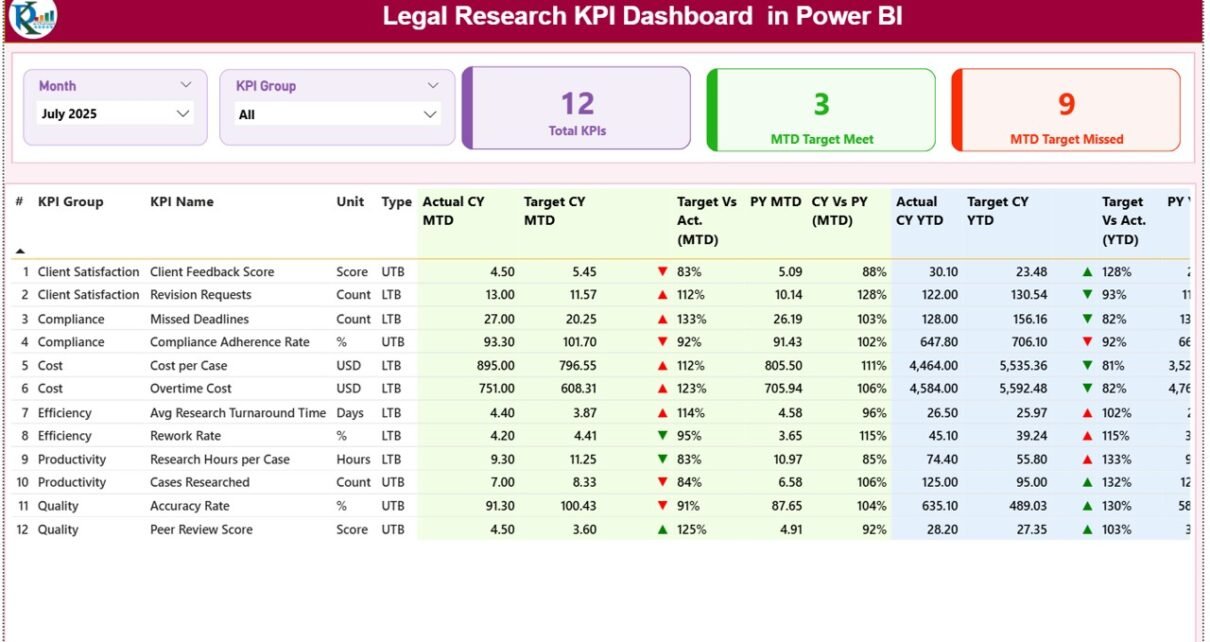
The Summary Page is the main page of the Legal Research KPI Dashboard in Power BI. This page provides a consolidated view of all KPIs.
Slicers for Dynamic Filtering
At the top of the Summary Page, users can filter data using:
-
Month slicer
-
KPI Group slicer
Once users apply these slicers, all visuals update instantly. Therefore, analysis remains fast and flexible.
KPI Performance Cards
Below the slicers, the dashboard displays three KPI cards:
-
Total KPIs Count
-
MTD Target Met Count
-
MTD Target Missed Count
These cards provide an immediate snapshot of overall performance.
Detailed KPI Performance Table
Below the cards, the dashboard displays a detailed and interactive table with the following columns:
-
KPI Number – Sequence number of the KPI
-
KPI Group – Category of the KPI
-
KPI Name – Name of the KPI
-
Unit – Measurement unit
-
Type – KPI type (LTB or UTB)
MTD Performance Metrics
For Month-to-Date analysis, the table shows:
-
Actual CY MTD – Current year actual MTD value
-
Target CY MTD – Current year target MTD value
-
MTD Icon – ▲ or ▼ icons with green or red color to indicate status
-
Target vs Actual (MTD) – Actual ÷ Target percentage
-
PY MTD – Previous year MTD value
-
CY vs PY (MTD) – Current year vs previous year comparison percentage
Because of these columns, users can quickly assess short-term performance.
YTD Performance Metrics
For Year-to-Date analysis, the table also shows:
-
Actual CY YTD – Current year actual YTD value
-
Target CY YTD – Current year target YTD value
-
YTD Icon – ▲ or ▼ icons with performance status
-
Target vs Actual (YTD) – Actual ÷ Target percentage
-
PY YTD – Previous year YTD value
-
CY vs PY (YTD) – Current year vs previous year comparison
As a result, users gain both tactical and strategic performance insights.
Click to Purchases Legal Research KPI Dashboard in Power BI
KPI Trend Page: Visual Trend Analysis
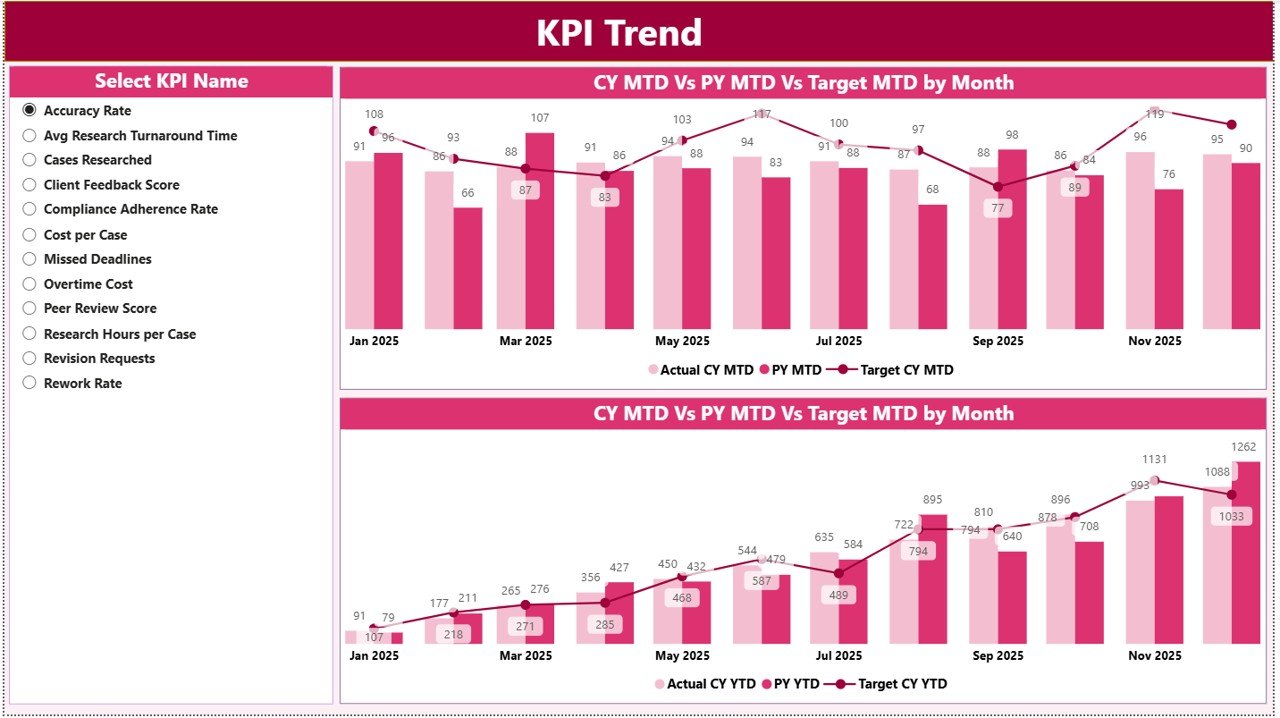
While the Summary Page shows performance at a glance, the KPI Trend Page focuses on trends over time.
KPI Selection Slicer
On the left side of the page, users can select a KPI Name using a slicer. Once selected, all charts update dynamically.
Combo Charts for Trend Analysis
This page displays two combo charts:
-
MTD Trend Chart
-
YTD Trend Chart
Each chart shows:
-
Current Year Actual values
-
Previous Year Actual values
-
Target values
Because of this setup, users can clearly see how performance changes over time.
Why Trend Analysis Matters in Legal Research
Legal research workloads vary based on cases, regulations, and deadlines. Therefore, trend analysis helps teams:
-
Identify consistent underperformance
-
Spot improvement patterns
-
Compare seasonal research output
-
Plan staffing and workloads
As a result, legal leaders make better operational decisions.
KPI Definition Page: Drill-Through KPI Details
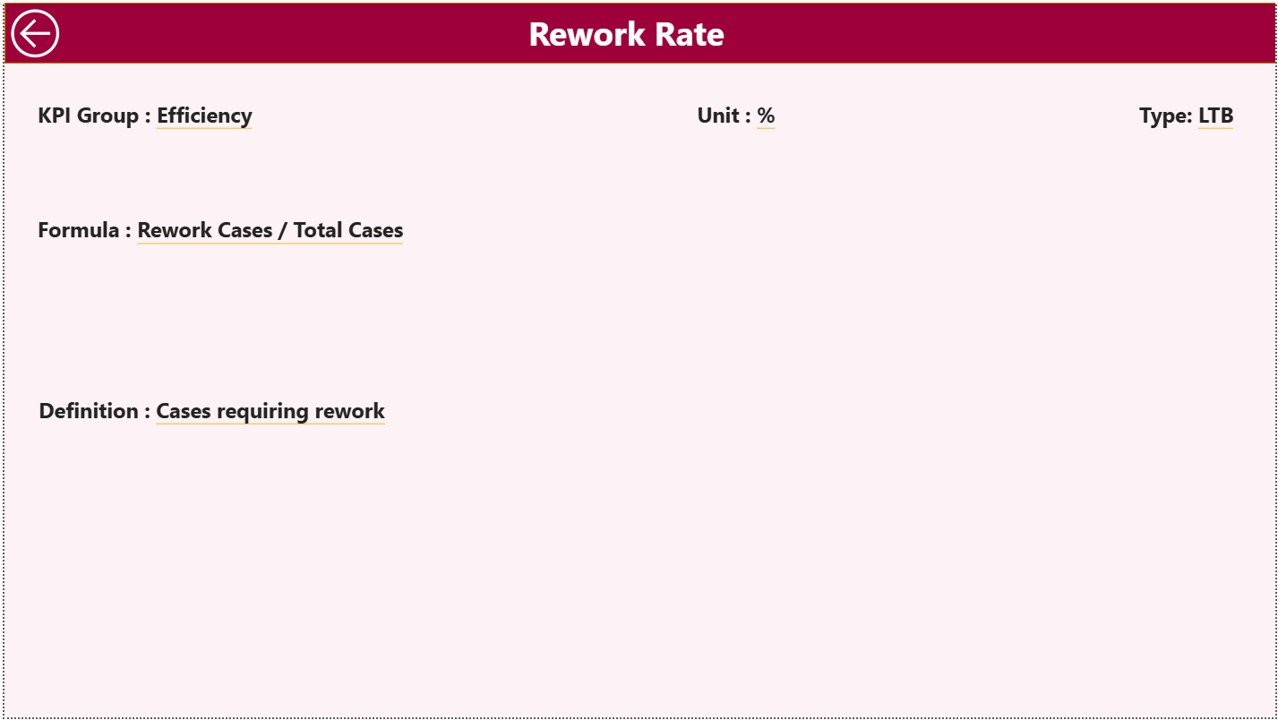
The KPI Definition Page provides detailed information about individual KPIs.
Drill-Through Functionality
This page remains hidden by default. From the Summary Page, users can drill through on a KPI to view its details.
KPI Information Displayed
On this page, users can view:
-
KPI Formula
-
KPI Definition
This design ensures clarity and avoids confusion while analyzing metrics.
Easy Navigation Back
To return to the Summary Page, users can click the Back button available at the top-left corner.
Excel Data Source: Simple and Structured Input
This Power BI dashboard uses an Excel file as its data source. This approach keeps data entry simple and familiar.
Click to Purchases Legal Research KPI Dashboard in Power BI
Input_Actual Sheet: Enter Actual Performance Data
In the Input_Actual sheet, users enter:
-
KPI Name
-
Month (first date of the month)
-
MTD Actual value
-
YTD Actual value
As soon as users update this sheet, the dashboard refreshes with new results.
Input_Target Sheet: Define KPI Targets
In the Input_Target sheet, users enter:
-
KPI Name
-
Month (first date of the month)
-
MTD Target value
-
YTD Target value
Targets drive performance evaluation, so this sheet plays a critical role.
KPI Definition Sheet: Maintain KPI Clarity
In the KPI Definition sheet, users define:
-
KPI Number
-
KPI Group
-
KPI Name
-
Unit
-
Formula
-
Definition
-
KPI Type (LTB or UTB)
Because of this sheet, all KPIs remain standardized and well-documented.
How This Dashboard Improves Legal Research Performance
This dashboard improves performance by transforming raw data into actionable insights.
First, it highlights target achievement clearly.
Second, it compares current performance with previous years.
Third, it visualizes trends using interactive charts.
Finally, it enables drill-through analysis for deeper understanding.
Because all insights appear in one Power BI file, decision-making becomes faster and more accurate.
Click to Purchases Legal Research KPI Dashboard in Power BI
Advantages of Legal Research KPI Dashboard in Power BI
Using this dashboard provides several key benefits.
Interactive Performance Analysis
Power BI slicers and visuals allow instant filtering and exploration.
Clear MTD and YTD Tracking
Short-term and long-term performance stays visible at all times.
Strong Visual Indicators
Icons, colors, and combo charts simplify interpretation.
Excel-Based Data Entry
Teams can update data easily without technical complexity.
Better Accountability and Control
Clear KPI ownership and targets improve accountability.
Scalable Analytics Solution
This dashboard grows easily as KPIs and data volume increase.
Click to Purchases Legal Research KPI Dashboard in Power BI
Best Practices for Legal Research KPI Dashboard in Power BI
To get maximum value from this dashboard, follow these best practices.
Define KPIs Clearly
Maintain accurate formulas and definitions in the KPI Definition sheet.
Update Data Consistently
Regular data updates ensure reliable insights.
Review KPIs Monthly
Monthly reviews help identify issues early.
Use Trend Charts for Planning
Always analyze trends instead of focusing only on current values.
Align Targets with Team Capacity
Set realistic targets based on workload and resources.
Click to Purchases Legal Research KPI Dashboard in Power BI
Who Should Use a Legal Research KPI Dashboard in Power BI?
This dashboard suits many legal roles, including:
-
Law firms
-
Corporate legal departments
-
Compliance teams
-
Legal research analysts
-
Regulatory bodies
-
Legal operations managers
Because of its flexible design, it adapts easily to different legal environments.
Common Use Cases of Legal Research KPI Dashboard
Organizations can use this dashboard for:
-
Legal research productivity tracking
-
Compliance research performance monitoring
-
Case preparation efficiency analysis
-
Legal operations reporting
Conclusion: Why Use a Legal Research KPI Dashboard in Power BI?
A Legal Research KPI Dashboard in Power BI delivers a modern, interactive, and data-driven approach to legal performance tracking. Instead of relying on static reports, legal teams can analyze MTD and YTD KPIs, compare actual vs target, and evaluate previous year performance instantly.
With features like interactive slicers, KPI cards, trend charts, and drill-through definitions, this dashboard becomes a powerful tool for performance-focused legal organizations.
If you want deeper insights, better control, and faster decisions in legal research operations, this Power BI dashboard is an excellent choice.
Click to Purchases Legal Research KPI Dashboard in Power BI
Frequently Asked Questions (FAQs)
What is a Legal Research KPI Dashboard in Power BI?
It is an interactive Power BI dashboard used to track legal research KPIs using MTD, YTD, and trend analysis.
Can I customize KPIs in this dashboard?
Yes, you can easily add or modify KPIs through the Excel data source.
Does the dashboard update automatically?
Yes, the dashboard refreshes automatically when Excel data changes.
Do I need Power BI expertise to use it?
No, end users only need basic Power BI navigation skills.
Can I compare current performance with previous years?
Yes, the dashboard includes full previous year comparisons.
Is this dashboard suitable for small legal teams?
Yes, both small and large legal teams can use it effectively.
Can I drill through to see KPI definitions?
Yes, the dashboard includes a drill-through KPI Definition page.
Click to Purchases Legal Research KPI Dashboard in Power BI
Visit our YouTube channel to learn step-by-step video tutorials