Running a cruise line business involves managing complex operations every single day. From passenger satisfaction and onboard revenue to fuel costs and occupancy rates, cruise companies track hundreds of performance metrics. However, many teams still rely on disconnected Excel sheets, manual reports, and delayed analysis. As a result, leaders struggle to see the real performance picture on time.
That is exactly where a Cruise Lines KPI Dashboard in Excel becomes extremely valuable.
This ready-to-use dashboard helps cruise operators track Month-to-Date (MTD) and Year-to-Date (YTD) performance, compare actual results with targets and previous year data, and analyze trends using interactive visuals. Moreover, it works entirely in Excel, which makes it easy to adopt across teams.
In this detailed article, you will learn what a Cruise Lines KPI Dashboard in Excel is, how it works, its worksheets, key features, advantages, best practices, and frequently asked questions.
Click to Purchases Cruise Lines KPI Dashboard in Excel
What Is a Cruise Lines KPI Dashboard in Excel?
A Cruise Lines KPI Dashboard in Excel is an interactive performance monitoring tool designed specifically for cruise industry operations.
Instead of reviewing raw numbers in multiple sheets, this dashboard allows cruise management teams to:
-
Track operational and financial KPIs in one place
-
Monitor MTD and YTD performance instantly
-
Compare Actual vs Target vs Previous Year values
-
Identify performance gaps using visual indicators
-
Analyze KPI trends over time
Because the dashboard runs in Excel, users do not need any advanced analytics software. As a result, teams can start using it immediately.
Why Do Cruise Lines Need a KPI Dashboard in Excel?
Cruise line operations involve multiple departments such as operations, sales, hospitality, finance, and safety. Therefore, leadership teams must track KPIs regularly to ensure smooth operations.
A Cruise Lines KPI Dashboard in Excel helps because:
-
It centralizes all KPIs into one dashboard
-
It reduces manual reporting effort
-
It improves decision-making speed
-
It increases performance transparency
-
It supports data-driven planning
Moreover, Excel remains familiar to most professionals, which makes this solution practical and cost-effective.
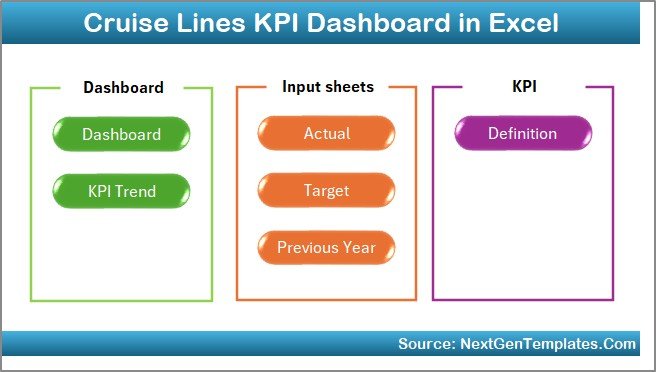
How Does the Cruise Lines KPI Dashboard in Excel Work?
The Cruise Lines KPI Dashboard works through seven interconnected worksheets. Each sheet serves a specific purpose, while all of them connect to structured KPI data.
Let’s explore each worksheet in detail.
Click to Purchases Cruise Lines KPI Dashboard in Excel
What Is the Home Sheet in the Cruise Lines KPI Dashboard?
The Home Sheet acts as the navigation center of the dashboard.
Key Purpose of the Home Sheet
-
Provides a clean index layout
-
Improves dashboard usability
-
Allows quick navigation between sheets
Navigation Buttons on the Home Sheet
The Home Sheet includes six buttons, each designed to jump directly to a specific worksheet. Because of this setup, users do not need to scroll or search manually.
As a result, even first-time users can navigate the dashboard comfortably.
What Information Does the Main Dashboard Sheet Show?
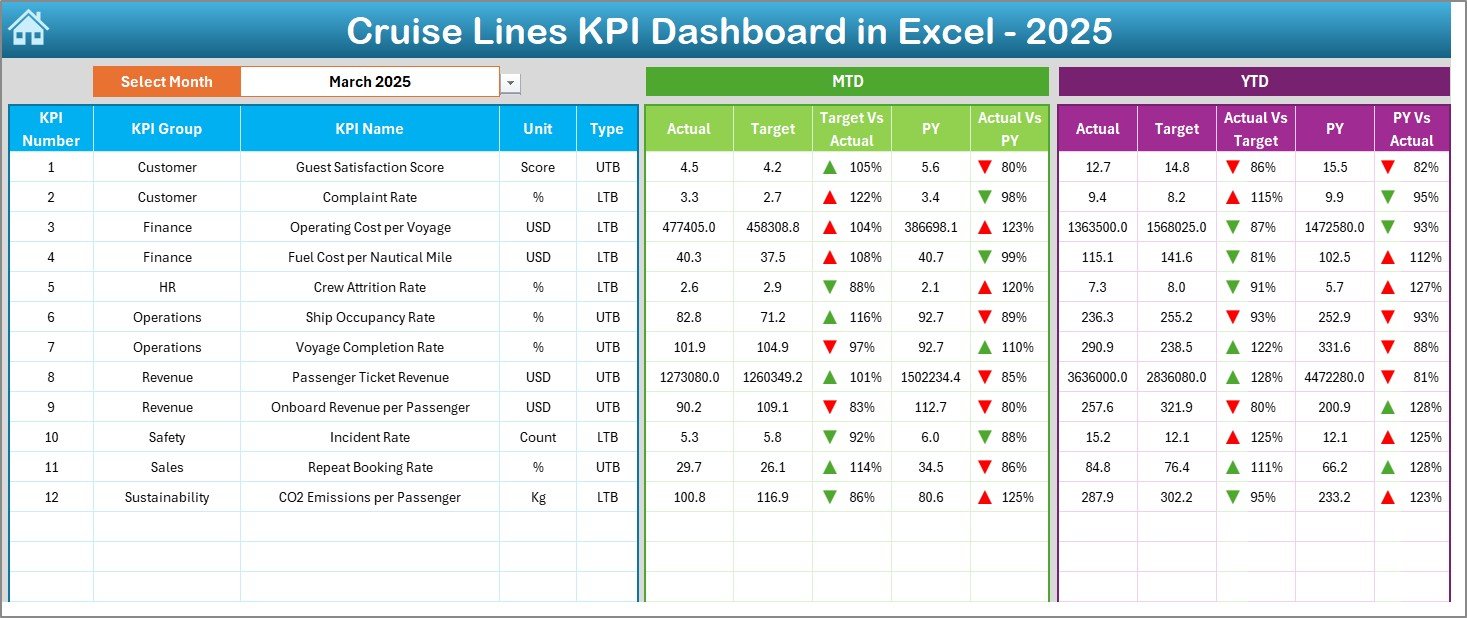
The Dashboard Sheet serves as the core of the entire KPI solution.
How Can You Select the Month?
At cell D3, the dashboard provides a Month drop-down. When you select a month:
-
All dashboard numbers update automatically
-
Charts and indicators refresh instantly
This feature enables quick month-wise analysis.
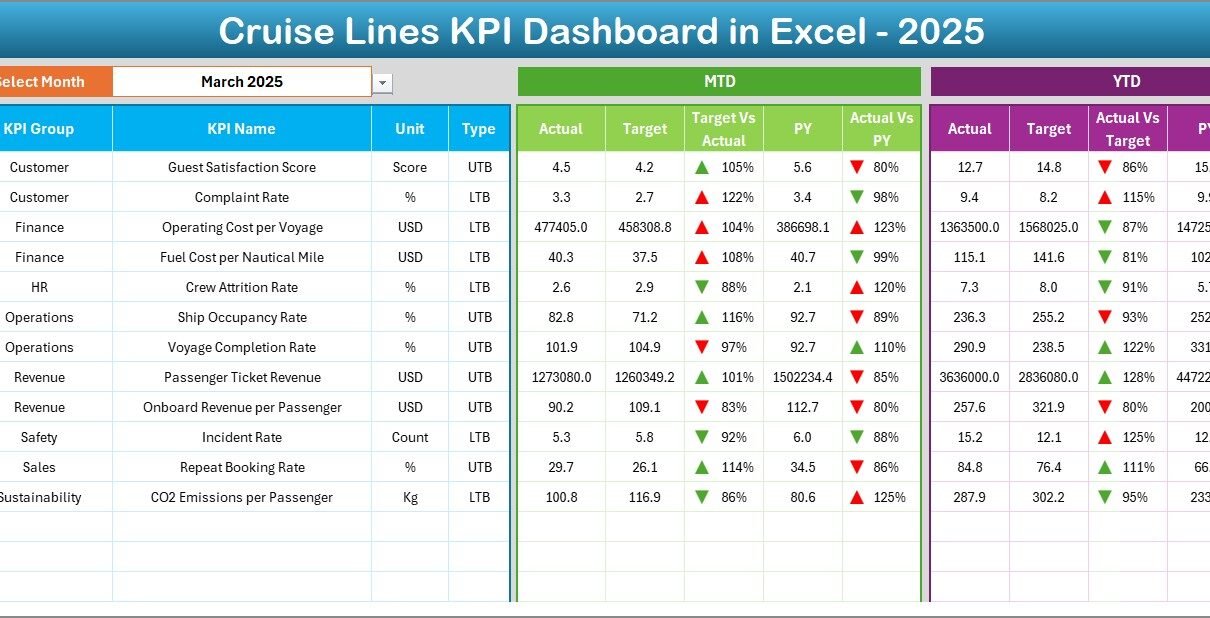
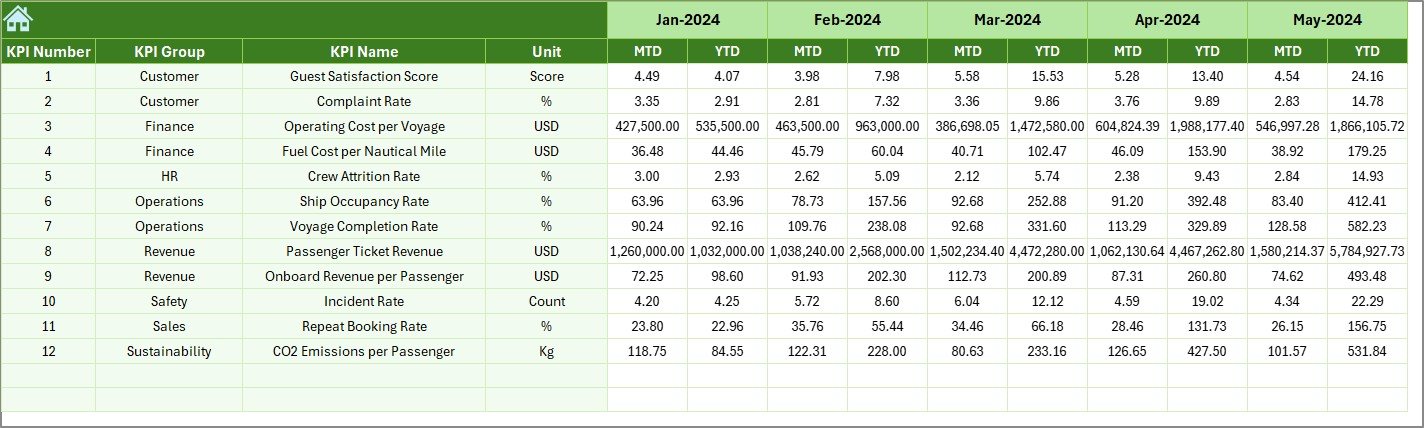
What KPIs Are Displayed on the Dashboard?
The dashboard displays KPI performance in two main sections:
MTD Performance Section
In the MTD section, the dashboard shows:
-
MTD Actual
-
MTD Target
-
MTD Previous Year
-
Target vs Actual variance
-
Previous Year vs Actual variance
Additionally, the dashboard uses conditional formatting with up and down arrows. These arrows clearly indicate performance improvement or decline.
YTD Performance Section
In the YTD section, the dashboard displays:
-
YTD Actual
-
YTD Target
-
YTD Previous Year
-
Target vs Actual variance
-
Previous Year vs Actual variance
Because of this structure, leadership teams can evaluate both short-term and long-term performance.
Click to Purchases Cruise Lines KPI Dashboard in Excel
How Does the KPI Trend Sheet Help with Analysis?
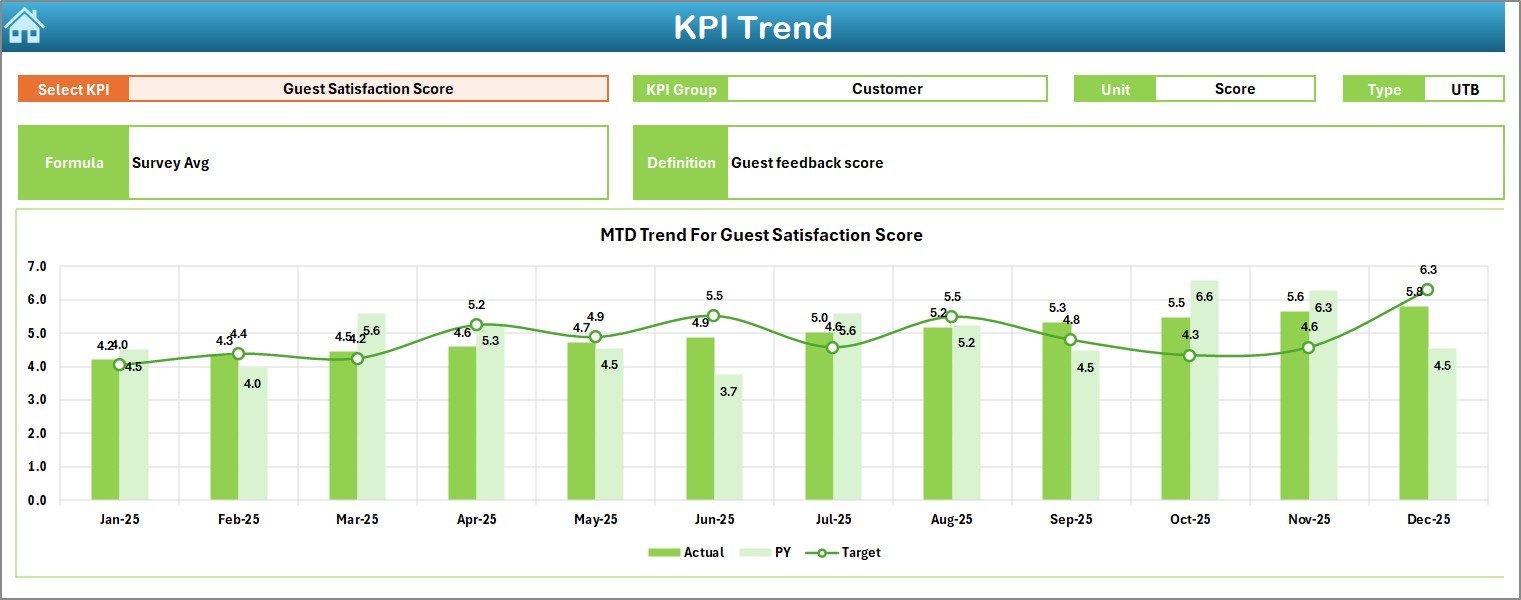
The KPI Trend Sheet focuses on deep analysis for individual KPIs.
How Can You Select a KPI?
At cell C3, the dashboard provides a KPI Name drop-down. Once you select a KPI, the sheet updates automatically.
What KPI Details Are Displayed?
The KPI Trend Sheet displays the following information:
-
KPI Group
-
KPI Unit
-
KPI Type (Lower the Better or Upper the Better)
-
KPI Formula
-
KPI Definition
This information helps users clearly understand what the KPI represents.
What Trend Charts Are Shown?
The KPI Trend Sheet displays:
-
MTD Trend Chart for Actual, Target, and Previous Year
-
YTD Trend Chart for Actual, Target, and Previous Year
These charts help identify patterns, seasonal behavior, and performance gaps over time.
Click to Purchases Cruise Lines KPI Dashboard in Excel
How Do You Enter Actual Numbers in the Dashboard?
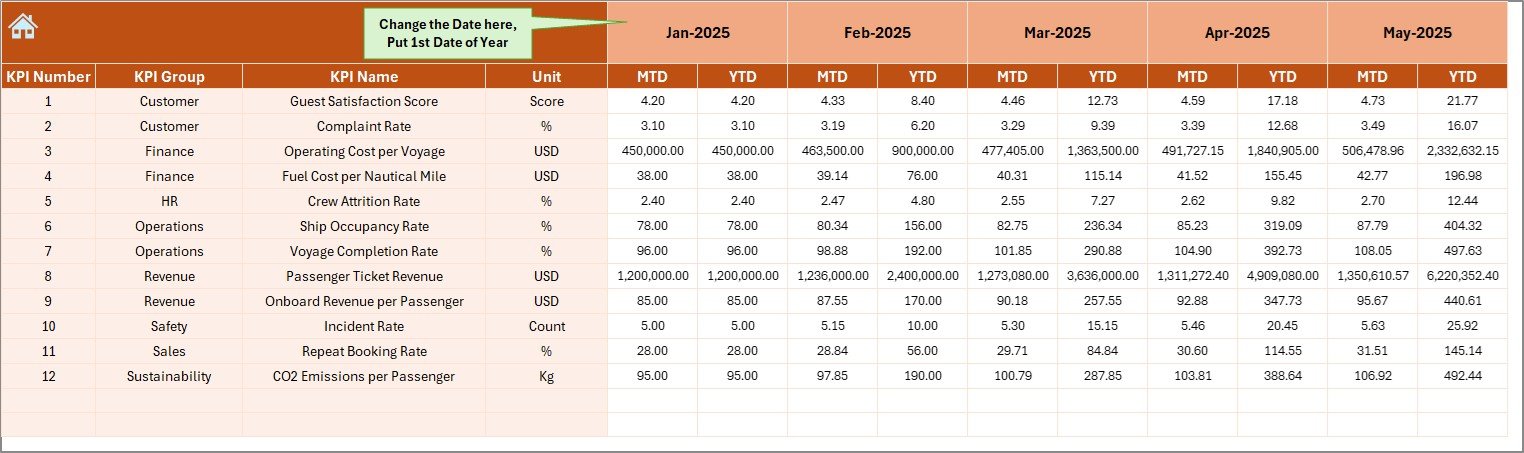
The Actual Numbers Input Sheet captures real performance data.
How Does Month Selection Work?
At cell E1, you enter the first month of the year. Once you define the starting month:
-
The dashboard structures the year automatically
-
You can enter MTD and YTD actual numbers easily
What Data Do You Enter Here?
On this sheet, you enter:
-
MTD Actual values for each KPI
-
YTD Actual values for each KPI
Because of this clear structure, data entry remains simple and error-free.
How Do You Set Targets in the Dashboard?
The Target Sheet stores all KPI target values.
What Target Values Can You Enter?
For each KPI, you can enter:
-
MTD Target values
-
YTD Target values
These targets help the dashboard calculate variances and performance indicators automatically.
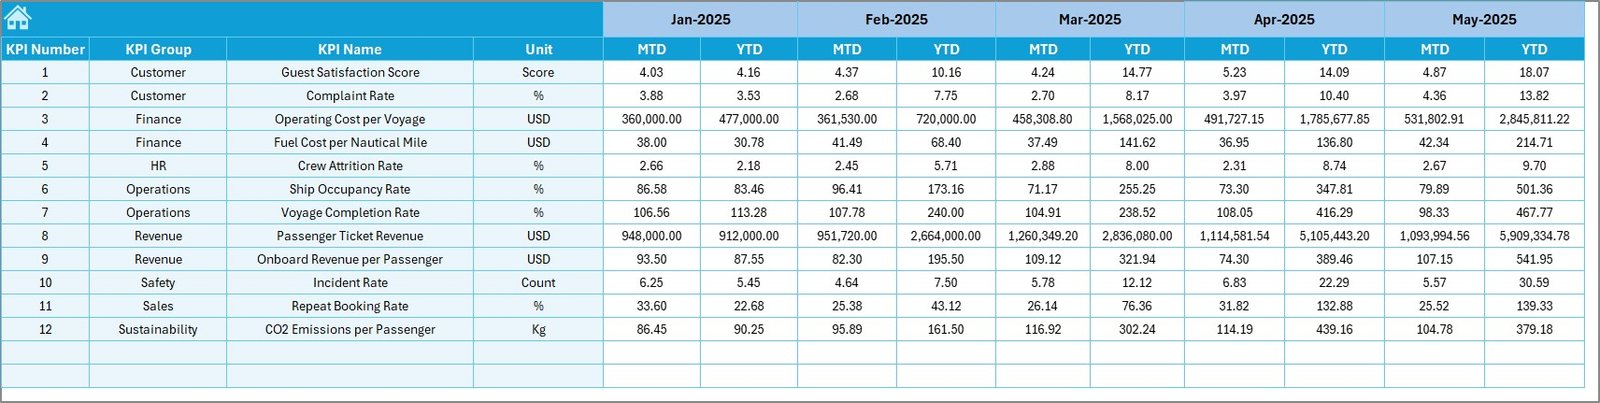
How Does the Previous Year Numbers Sheet Work?
The Previous Year Number Sheet captures historical performance data.
Why Is Previous Year Data Important?
Previous year data helps cruise companies:
-
Compare current performance with historical results
-
Identify growth or decline patterns
-
Measure long-term improvement
You enter data on this sheet in the same format as the current year.
Click to Purchases Cruise Lines KPI Dashboard in Excel
What Is the KPI Definition Sheet and Why Is It Important?
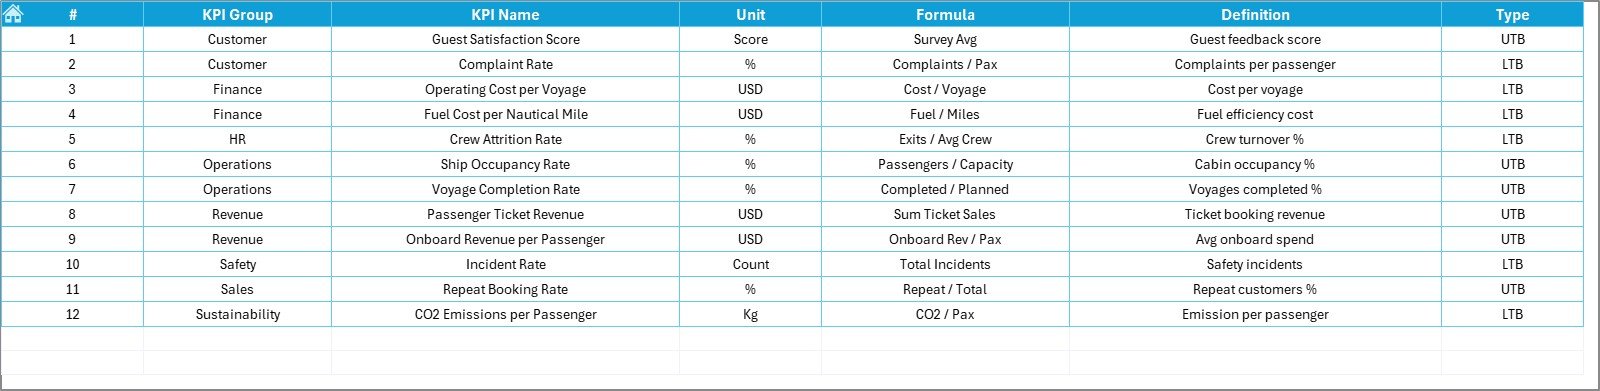
The KPI Definition Sheet acts as the reference foundation of the dashboard.
What Information Does This Sheet Store?
This sheet captures:
-
KPI Name
-
KPI Group
-
KPI Unit
-
KPI Formula
-
KPI Definition
Because of this sheet, all stakeholders understand KPIs clearly and consistently.
How Does This Dashboard Improve Cruise Line Decision-Making?
A Cruise Lines KPI Dashboard in Excel improves decision-making because it:
-
Shows real-time performance visibility
-
Highlights performance gaps clearly
-
Supports proactive corrective actions
-
Improves cross-department alignment
As a result, cruise operators can respond faster to operational challenges.
Click to Purchases Cruise Lines KPI Dashboard in Excel
Advantages of Cruise Lines KPI Dashboard in Excel
Using this dashboard delivers several strong advantages.
Key Advantages
-
Centralized KPI tracking in one Excel file
-
Clear MTD and YTD performance visibility
-
Actual vs Target vs Previous Year comparison
-
Visual performance indicators using arrows
-
Easy KPI trend analysis
-
No advanced software required
-
Scalable for small and large cruise operators
Moreover, Excel compatibility ensures easy adoption across teams.
Who Can Use the Cruise Lines KPI Dashboard?
This dashboard works well for:
-
Cruise Line Executives
-
Operations Managers
-
Finance and Revenue Teams
-
Fleet Management Teams
-
Business Analysts
-
Strategy and Planning Teams
Because of its structured design, both technical and non-technical users can use it confidently.
Best Practices for the Cruise Lines KPI Dashboard in Excel
Following best practices ensures reliable and meaningful insights.
1. Keep KPI Definitions Clear
-
Use simple KPI names
-
Maintain short and clear definitions
-
Avoid ambiguous formulas
2. Update Data Regularly
-
Enter actual numbers monthly
-
Review targets periodically
-
Update previous year data accurately
3. Review Trends Consistently
-
Analyze KPI trends every month
-
Compare YTD progress with targets
-
Identify early warning signs
4. Limit the Number of KPIs
-
Focus on business-critical KPIs
-
Avoid tracking too many metrics
-
Keep the dashboard easy to read
5. Protect the Dashboard Structure
-
Lock formula cells
-
Restrict editing to input sheets
-
Maintain regular backups
These practices improve dashboard reliability and long-term value.
How Is This Dashboard Better Than Manual Excel Reports?
Manual Excel reports require repetitive work and increase error risk. In contrast, this KPI dashboard:
-
Automates calculations
-
Standardizes KPI reporting
-
Reduces manual effort
-
Improves consistency
As a result, teams save time and focus more on analysis instead of data preparation.
Click to Purchases Cruise Lines KPI Dashboard in Excel
Conclusion: Should Cruise Lines Use a KPI Dashboard in Excel?
Yes, without any doubt.
A Cruise Lines KPI Dashboard in Excel provides a powerful yet simple solution for monitoring performance. With structured input sheets, interactive visuals, KPI trend analysis, and clear comparisons, this dashboard helps cruise companies stay in control of their operations.
Instead of managing scattered reports, teams can rely on one centralized dashboard. As a result, performance tracking becomes faster, clearer, and more effective.
Frequently Asked Questions (FAQs)
What is a Cruise Lines KPI Dashboard in Excel?
It is an Excel-based dashboard that helps cruise companies track MTD and YTD KPIs, targets, and trends in one file.
Can I track multiple KPIs in this dashboard?
Yes, you can track multiple KPIs using structured input and definition sheets.
Does this dashboard support trend analysis?
Yes, it includes MTD and YTD trend charts for Actual, Target, and Previous Year values.
Do I need advanced Excel skills to use this dashboard?
No, basic Excel knowledge is enough to use and maintain the dashboard.
Can I customize KPI definitions and targets?
Yes, you can easily customize KPI names, formulas, definitions, and target values.
Is this dashboard suitable for large cruise operations?
Yes, the scalable design makes it suitable for both small cruise operators and large cruise lines.
Click to Purchases Cruise Lines KPI Dashboard in Excel
Visit our YouTube channel to learn step-by-step video tutorials