Introduction
The IVF Centers KPI Dashboard is an invaluable tool designed to streamline performance tracking for IVF clinics. With this ready-to-use template, IVF centers can monitor key metrics in real-time, ensuring better decision-making and enhanced patient outcomes. This dashboard consolidates data efficiently, allowing clinic managers to visualize monthly and yearly performance against set targets seamlessly.
Key Features of IVF Centers KPI Dashboard
- Comprehensive overview of critical KPIs specific to IVF centers.
- Interactive month selection to filter data instantly.
- Multiple worksheets for detailed KPIs analysis, input, and definitions.
- Conditional formatting with up/down arrows to easily interpret performance variations.
- Trend analysis for both Month-To-Date (MTD) and Year-To-Date (YTD) comparisons.
- User-friendly navigation with home page buttons linking to different sheets.
- Clear KPI definitions including formulas and types (Lower the Better or Upper the Better).
Dashboard Pages Explanation
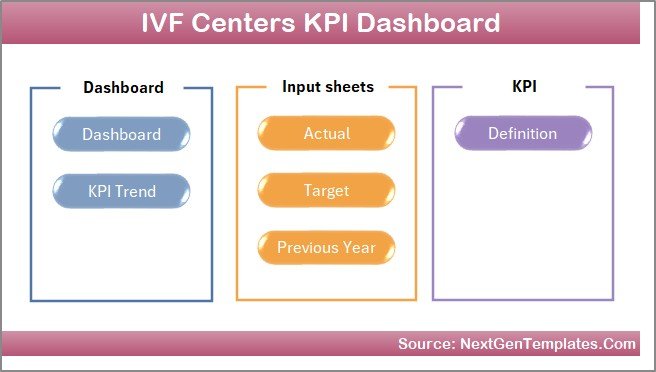
1. Home Sheet
This index sheet serves as the dashboard’s navigation hub. It contains six buttons that link directly to respective worksheet tabs, allowing users to jump to the desired section efficiently.
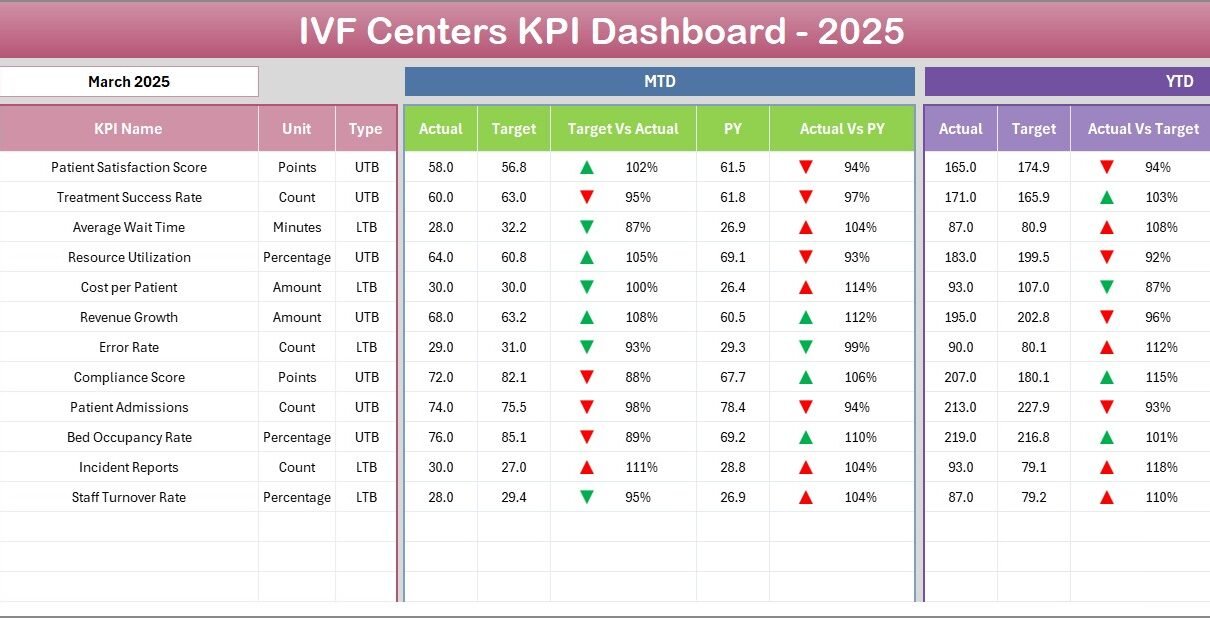
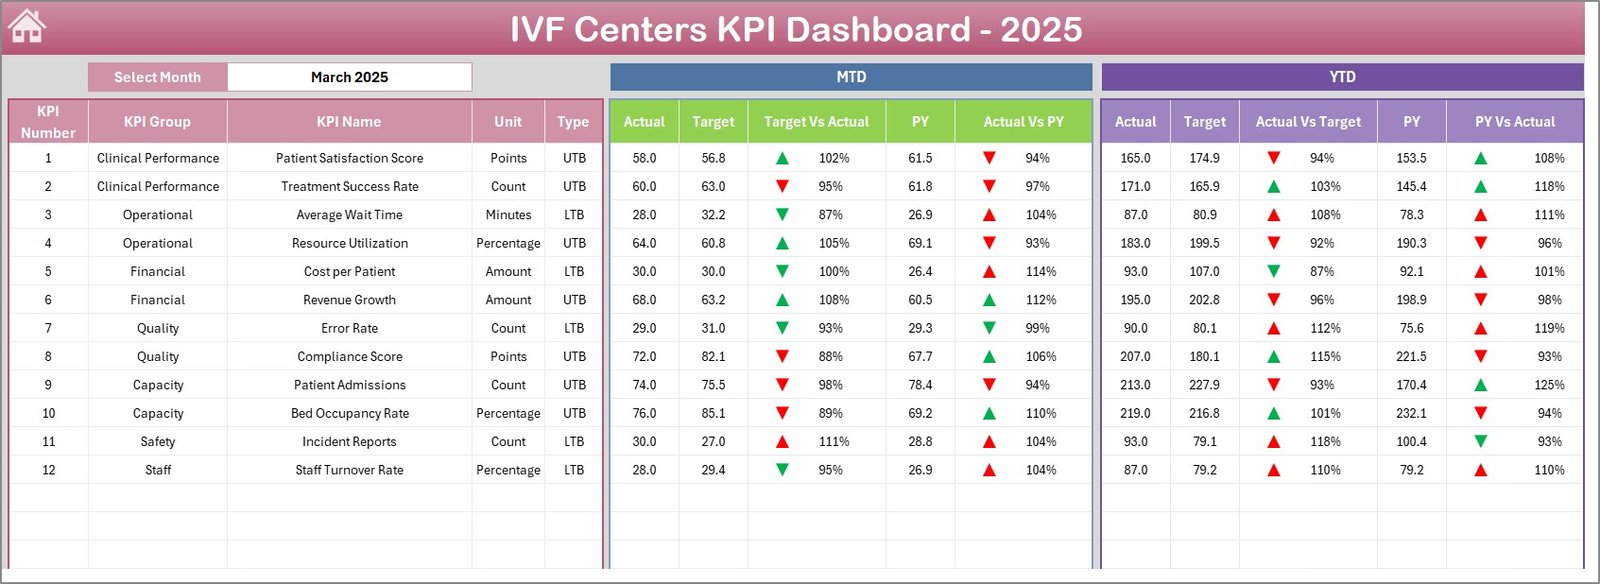
2. Dashboard Sheet
The heart of the template, this sheet provides a bird’s-eye view of all KPIs. Users can select a specific month from the dropdown located in cell D3, upon which the entire dashboard updates dynamically.
- Displays MTD (Month to Date) actuals, targets, and previous year data.
- Shows Target vs Actual and Previous Year vs Actual comparisons with color-coded conditional formatting and directional arrows for quick assessment.
- Provides YTD (Year to Date) data similarly summarized.
 IVF Centers KPI Dashboard
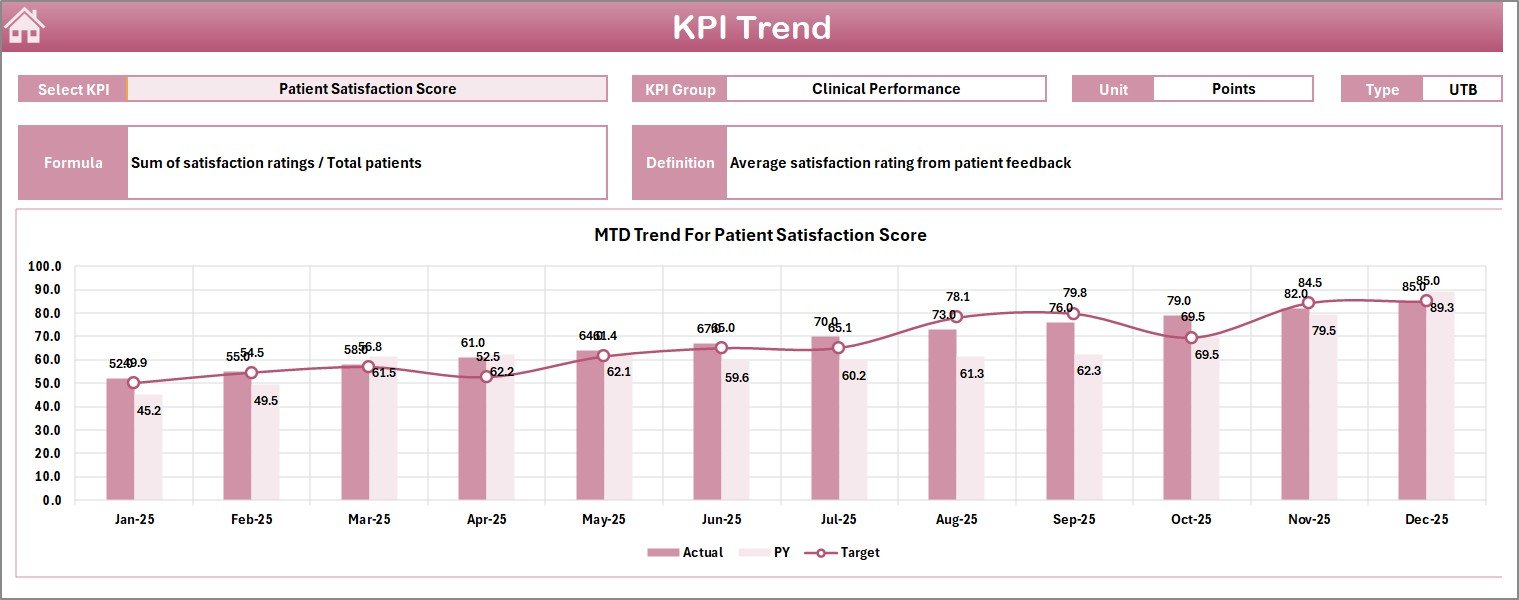
3. KPI Trend Sheet
This sheet enables deep dive into individual KPIs by selecting a KPI name from the dropdown at cell C3.
- Displays KPI Group, measurement units, type (Lower the Better or Upper the Better), formula, and detailed definition.
- Visualizes MTD and YTD trends for Actual, Target, and Previous Year figures through dynamic charts.
 KPI Trend Sheet
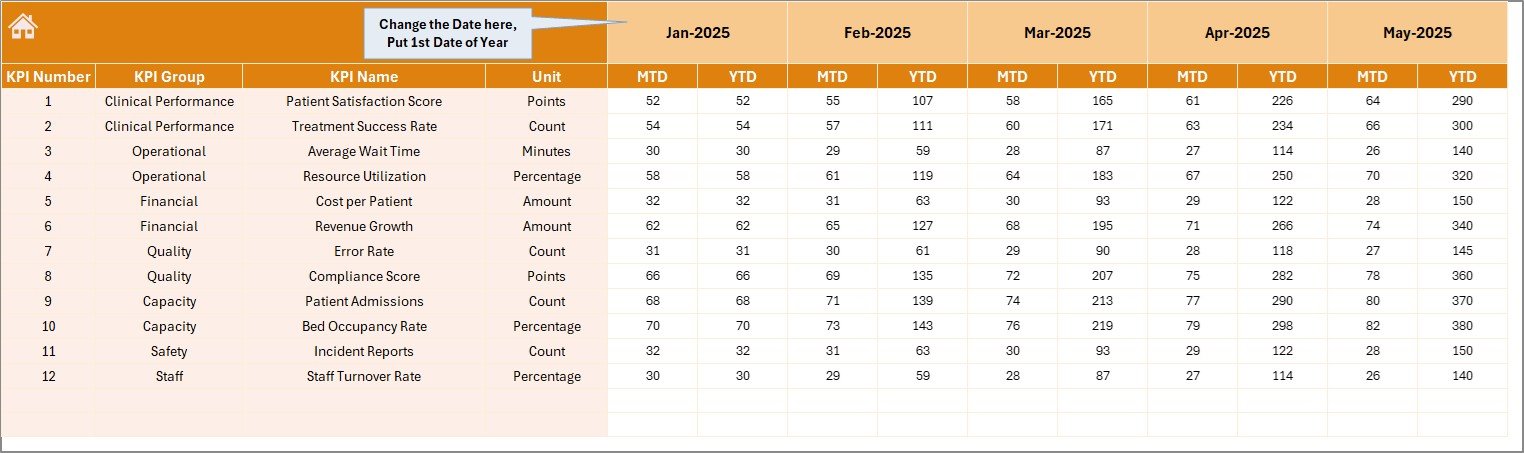
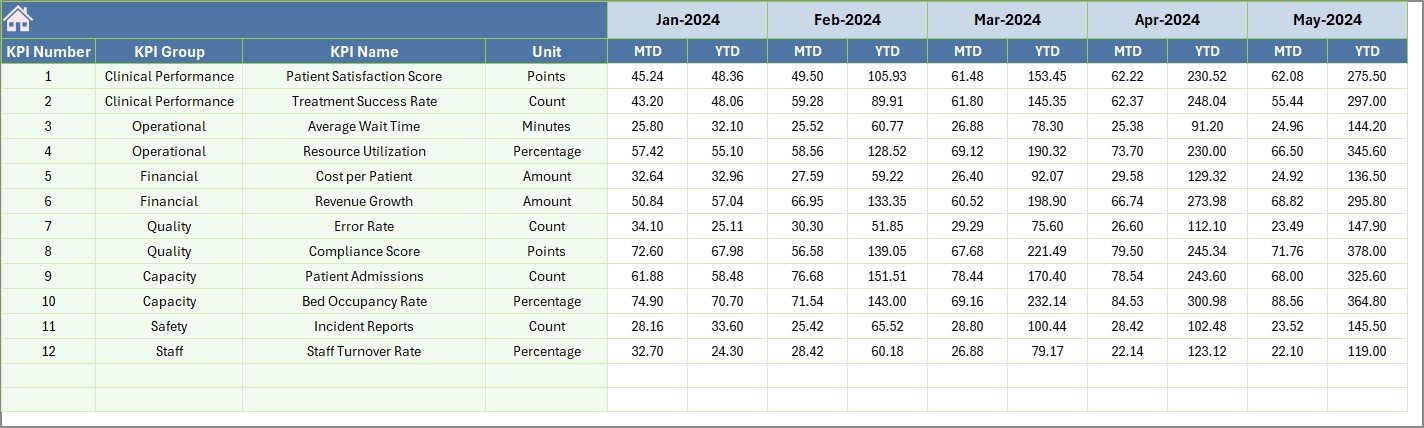
4. Actual Numbers Input Sheet
This tab is dedicated for entering actual numbers for each KPI on YTD and MTD basis. Users can modify the starting month of the year at cell E1 for accurate data alignment.
 Actual Numbers Input sheet
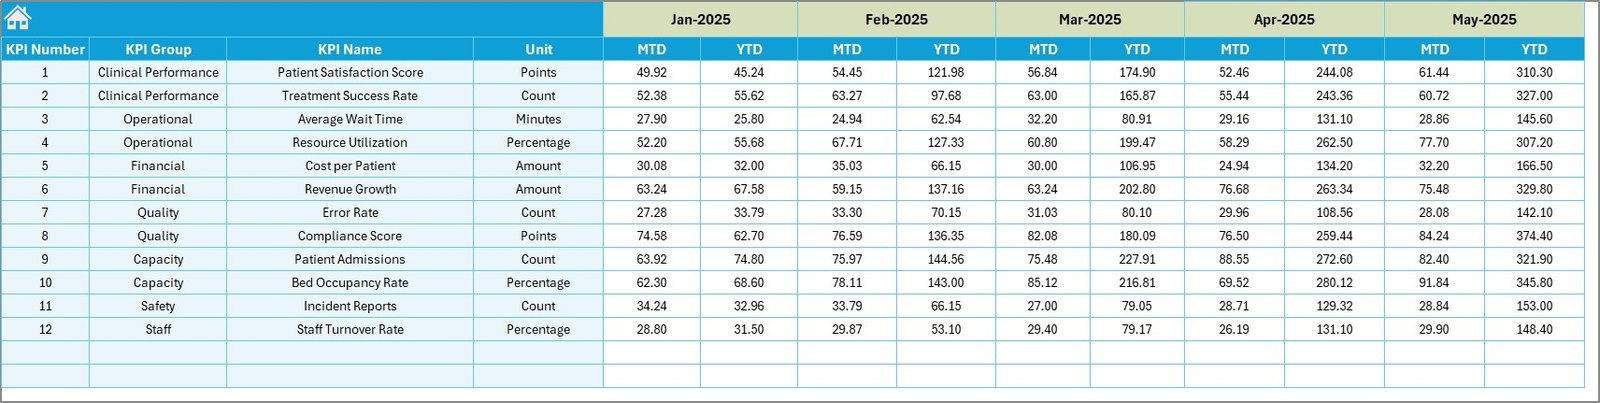
5. Target Number Input Sheet
Here, target values for each KPI must be inputted for both MTD and YTD. This ensures the dashboard can perform comparison analyses accurately.
 Target Number Input sheet
6. Previous Year Number Sheet
The previous year’s data for all KPIs should be entered here, mirroring the format used for the current year. This allows comparative yearly insights.
 Previous Year Number Input sheet
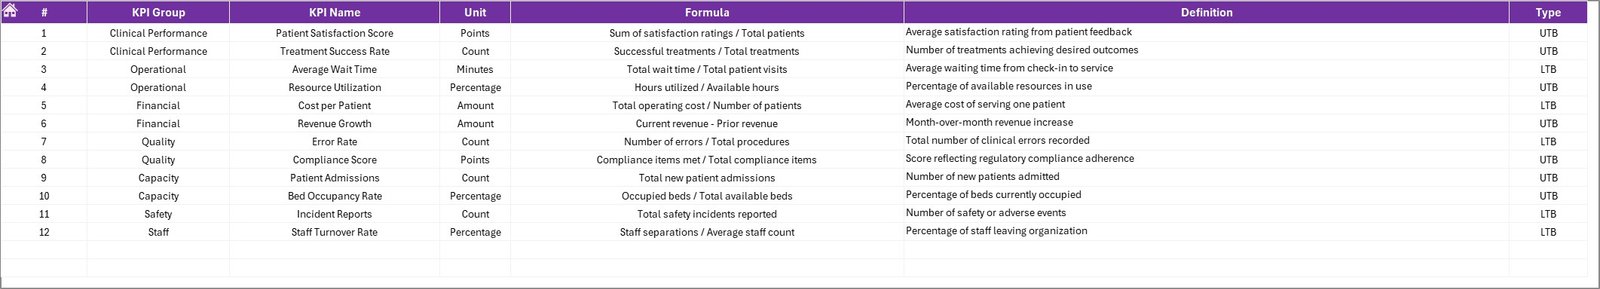
7. KPI Definition Sheet
This sheet is where you define all KPIs in detail.
- Enter KPI Name, Group, Unit of measure.
- Add the formula used to calculate each KPI.
- Include the KPI definition for clarity.
- Specify the KPI type as either LTB (Lower the Better) or UTB (Upper the Better) to help contextualize dashboard indications.
 KPI Definition sheet
Advantages of IVF Centers KPI Dashboard
- Improved Decision Making: Real-time visibility of KPIs allows managers to promptly address performance gaps.
- Efficient Data Management: Centralized data input and management reduces errors and redundant work.
- Enhanced Performance Monitoring: Tracks actuals against targets and historical performance amid a dynamic environment.
- User-Friendly Interface: Easy navigation and intuitive selections make it accessible for users of all technical levels.
- Customization Ready: Easily adaptable to include additional KPIs or metrics specific to clinic requirements.
Opportunities for Improvement
Click to Buy IVF Centers KPI Dashboard in Excel
- Integrate automated data import from Electronic Health Records (EHR) systems to reduce manual inputs.
- Enhance visualization with interactive dashboards using platforms like Power BI or Tableau for richer insights.
- Incorporate patient satisfaction and feedback metrics to provide a holistic view of IVF center performance.
- Add forecasting capabilities for predicting KPI trends based on historical data.
Best Practices
- Maintain accurate and timely data input in the ‘Actual’, ‘Target’, and ‘Previous Year’ sheets to ensure dashboard integrity.
- Regularly update KPI definitions and formulas to reflect current clinical standards.
- Train staff on how to interpret dashboard results, focusing on conditional formatting and trend arrows.
- Review dashboard monthly or quarterly in management meetings to align strategies.
- Leverage the KPI Trend sheet for root cause analysis during periods of underperformance.
FAQs
Click to Buy IVF Centers KPI Dashboard in Excel
What is the main purpose of the IVF Centers KPI Dashboard?
It helps IVF clinics monitor and analyze key performance indicators to optimize operational efficiency and patient outcomes.
Can I customize KPIs in this dashboard?
Yes, the KPI Definition sheet allows you to add or modify KPIs, their units, formulas, and other related settings.
Is prior Excel knowledge necessary to use this dashboard?
Basic Excel skills such as working with dropdown lists and navigation will suffice to use and maintain this dashboard effectively.
How often should we update data?
Data should ideally be updated monthly as per actual performance and targets to ensure accurate and actionable insights.
Conclusion
Click to Buy IVF Centers KPI Dashboard in Excel
The IVF Centers KPI Dashboard is an essential tool for IVF clinics aiming to elevate their performance monitoring capabilities. Its intuitive design, comprehensive data integration, and dynamic reporting empower healthcare providers to make informed decisions and continually enhance service delivery. Implementing this KPI dashboard will undoubtedly contribute to improved patient care and operational excellence in IVF centers.
For further learning, explore Microsoft’s official Excel resources: Microsoft Excel Support.
Visit our YouTube channel to watch the demo: Youtube.com/@NextGenTemplates
Click to Buy IVF Centers KPI Dashboard in Excel