The pest control industry in the US alone is valued at over $22 billion, with more than 25,000 companies employing hundreds of thousands of field technicians across residential and commercial accounts. Yet most small-to-medium pest control businesses still track revenue, service performance, and technician output in fragmented spreadsheets — or rely on the reporting module of a $150+/month field service SaaS platform they barely use.
The Pest Control Dashboard in Excel changes that. It’s a 5-page, pivot-driven analytics workbook consolidating your service data into clear, filterable views covering revenue trends, chemical usage, customer insights, and individual technician performance — all in Microsoft Excel, with zero subscription cost.
This post walks through every page, chart, and feature so you know exactly what you’re getting before you download.
Key Features of the Pest Control Dashboard in Excel
The dashboard tracks 5 core KPIs on the Overview page — Total Service Charge, Total Services, Net Profit, Avg. Satisfaction Score, and Avg. Charge Per Service — displayed as KPI cards for an instant operational health check. Below the cards, four analysis charts give a financial and geographic business overview. Multi-slicer filtering runs throughout all pages, so managers can isolate any region, time period, or technician with a single click, updating all charts simultaneously.
All charts are powered by pivot tables stored in a Support Sheet, following standard Excel pivot dashboard architecture. According to Microsoft Learn’s Excel documentation, pivot tables are the most scalable method for building auto-updating analytics on growing datasets. This dashboard uses exactly that approach: add data to the Data Sheet, click Data → Refresh All, and every chart, KPI, and slicer across all 5 pages updates instantly.
Dashboard Pages Explanation
Page 1: Overview
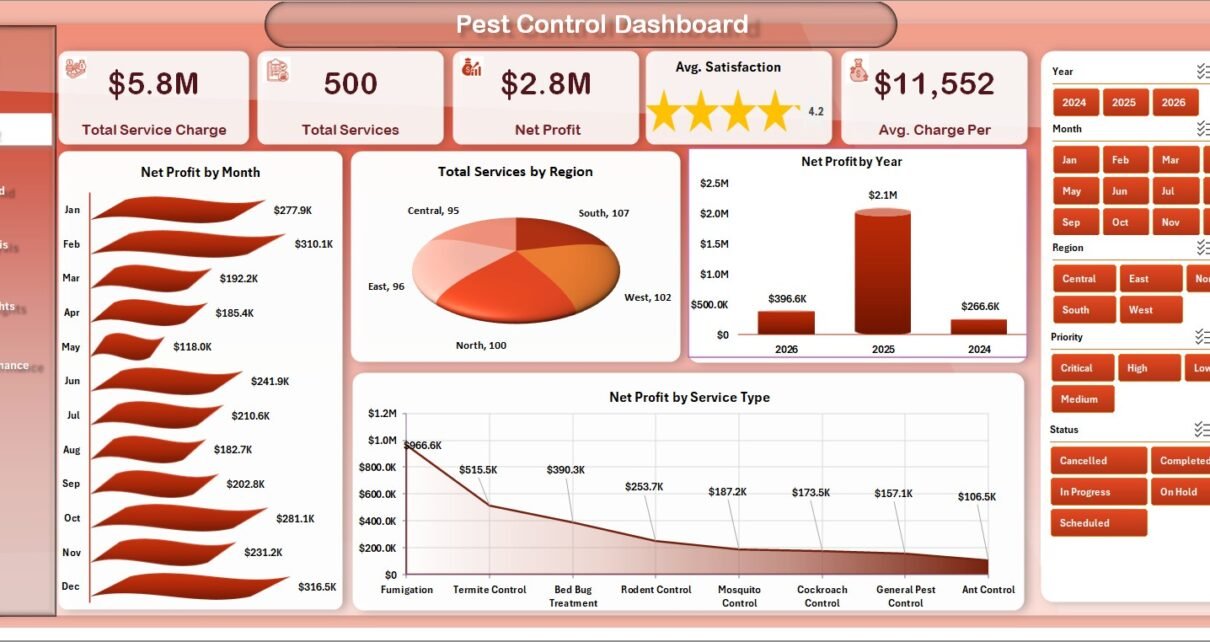
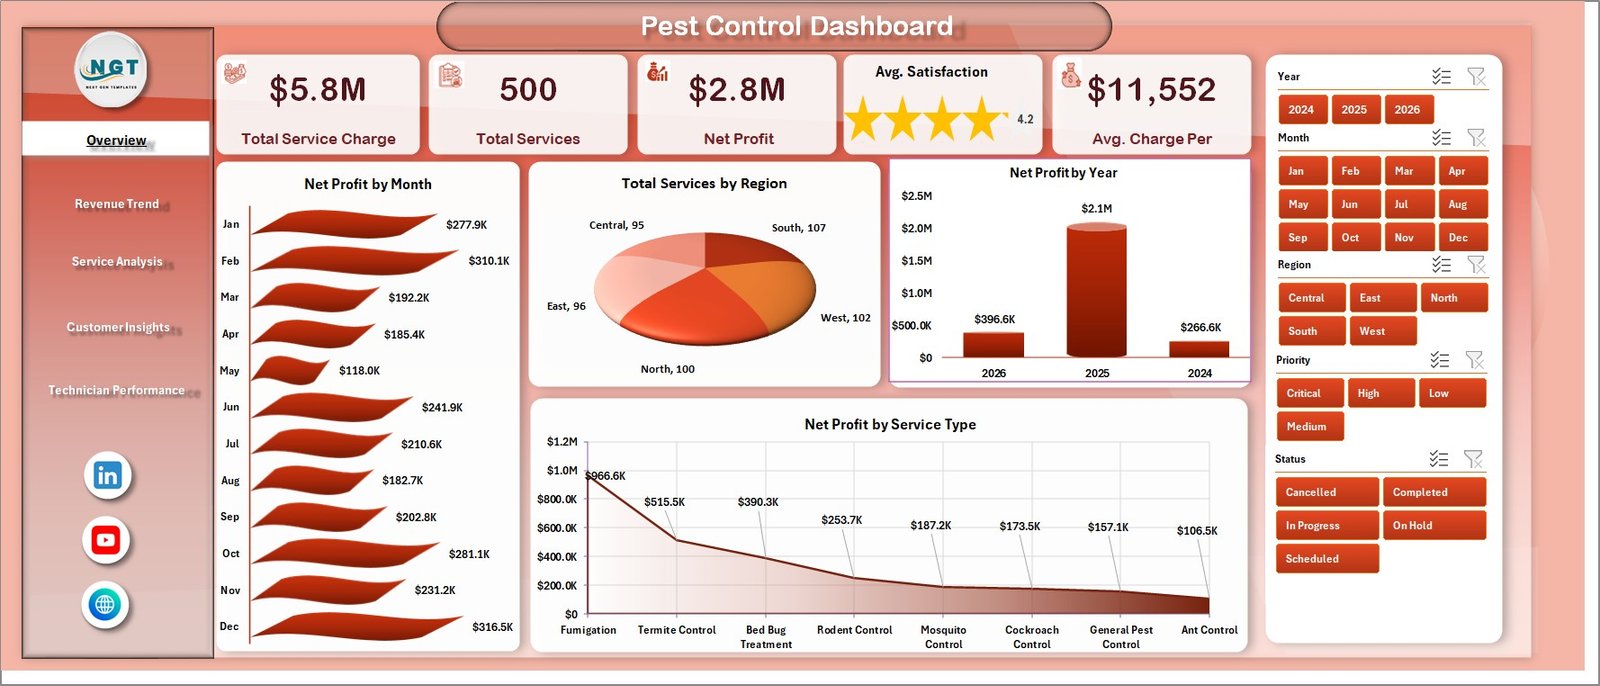
Pest Control Dashboard — Overview Page
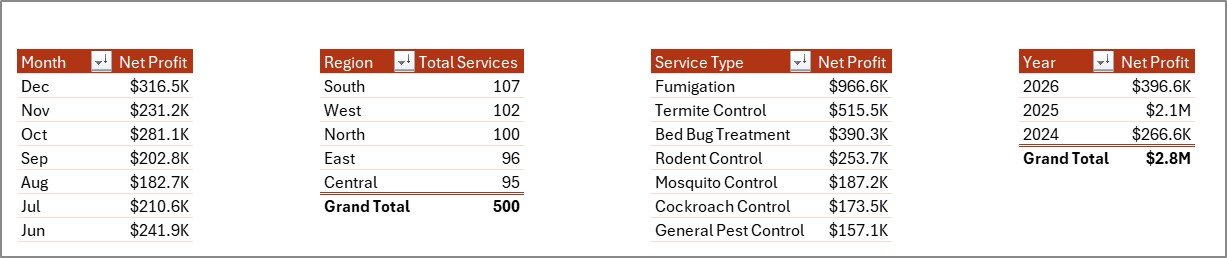
The Overview page opens with five KPI cards: Total Service Charge, Total Services, Net Profit, Avg. Satisfaction, and Avg. Charge Per Service — giving a company-wide performance snapshot at a glance. Four charts provide deeper context: Net Profit by Month reveals seasonal revenue patterns; Total Services by Region compares geographic footprint; Net Profit by Year shows growth trajectory; and Net Profit by Service Type identifies which treatment categories generate the most margin. Multiple slicers allow instant cross-filtering across all visuals.
Page 2: Revenue Trend
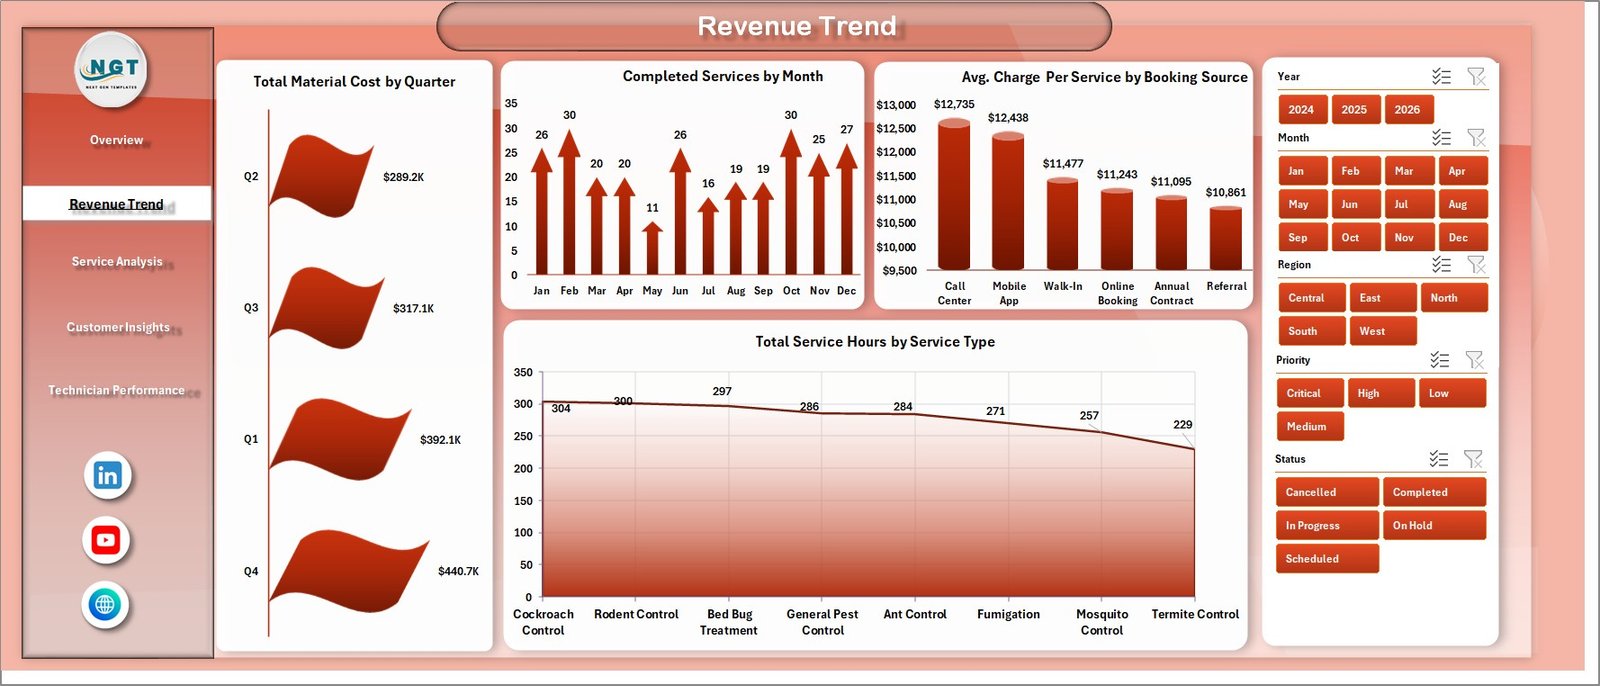 Revenue Trend Page
The Revenue Trend page analyzes cost and booking dynamics. Total Material Cost by Quarter tracks chemical and supply spend and supports procurement planning. Completed Services by Month maps booking volume trends and seasonal demand. Avg. Charge Per Service by Booking Source shows which acquisition channels — referrals, online, walk-ins — generate the highest-value jobs. Total Service Hours by Service Type connects labor hours to treatment categories for capacity planning.
Page 3: Service Analysis
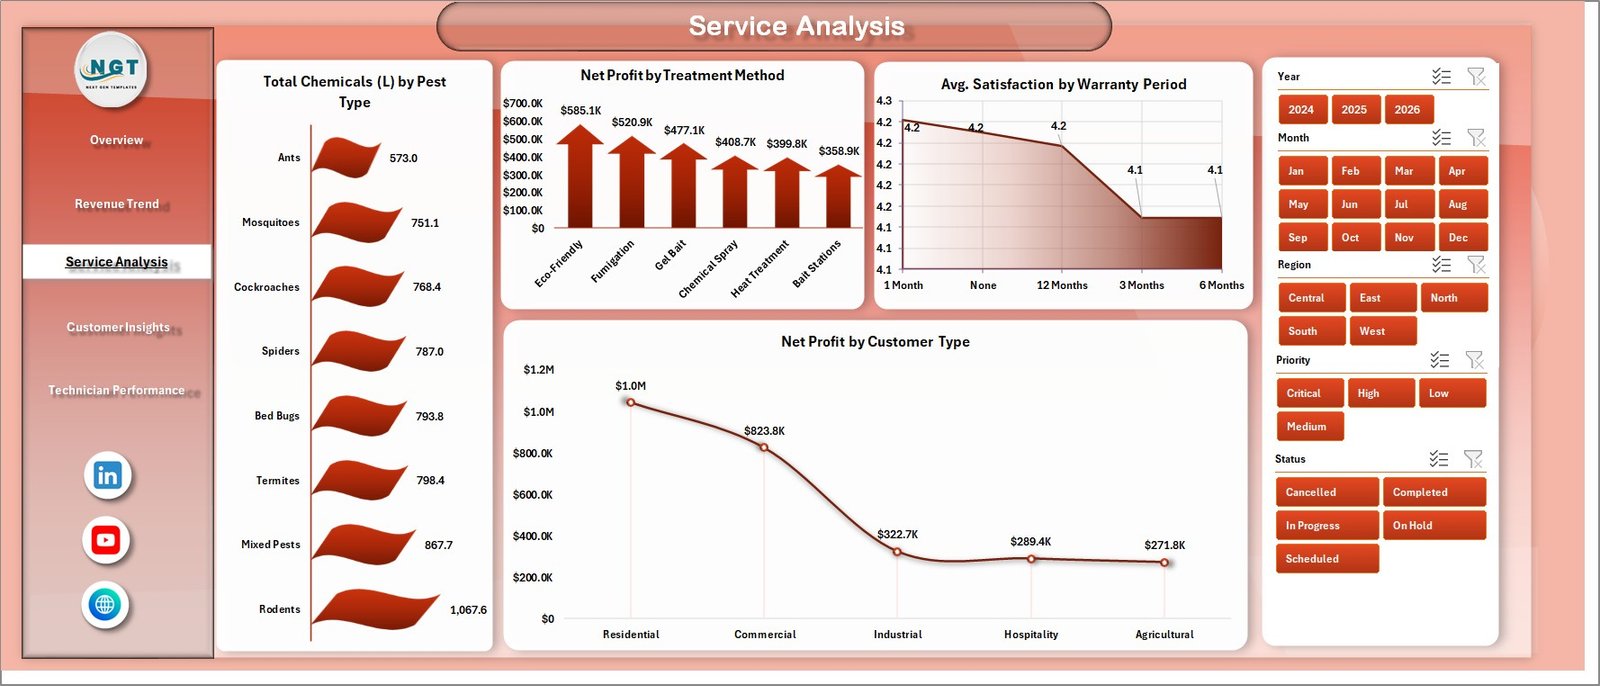 Service Analysis Page
The Service Analysis page digs into treatment operations. Total Chemicals (L) by Pest Type tracks chemical volume per pest category — useful for inventory control and supplier negotiations. Net Profit by Treatment Method shows which approaches (fumigation, spraying, baiting) are most profitable. Avg. Satisfaction by Warranty Period tests whether longer warranties correlate with higher customer satisfaction scores. Net Profit by Customer Type compares residential versus commercial account profitability.
Page 4: Customer Insights
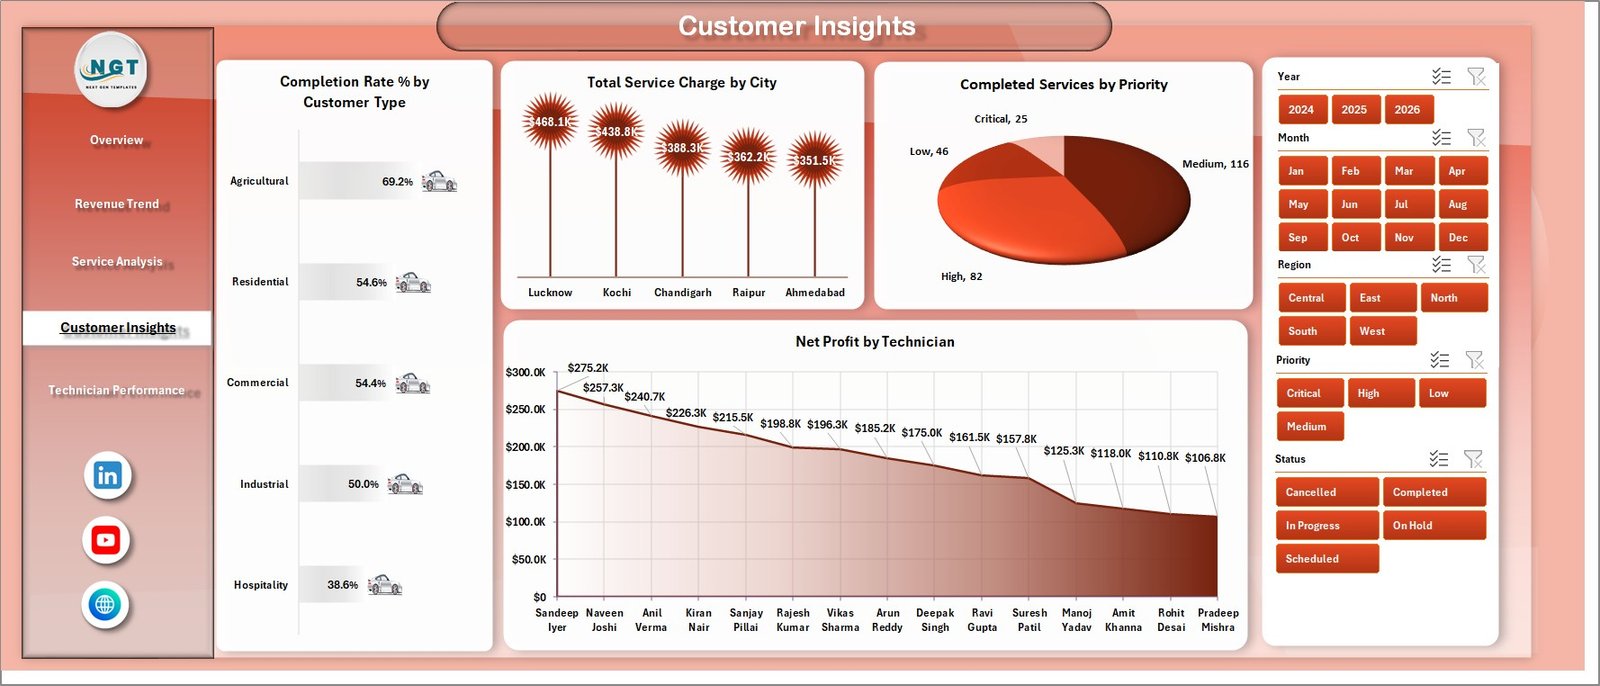 Customer Insights Page
Customer Insights maps performance to geography and customer segments. Completion Rate % by Customer Type reveals service fulfillment differences between account types. Total Service Charge by City shows revenue concentration across service territories. Completed Services by Priority tracks how emergency, routine, and scheduled jobs are distributed. Net Profit by Technician connects individual output to bottom-line contribution.
Page 5: Technician Performance
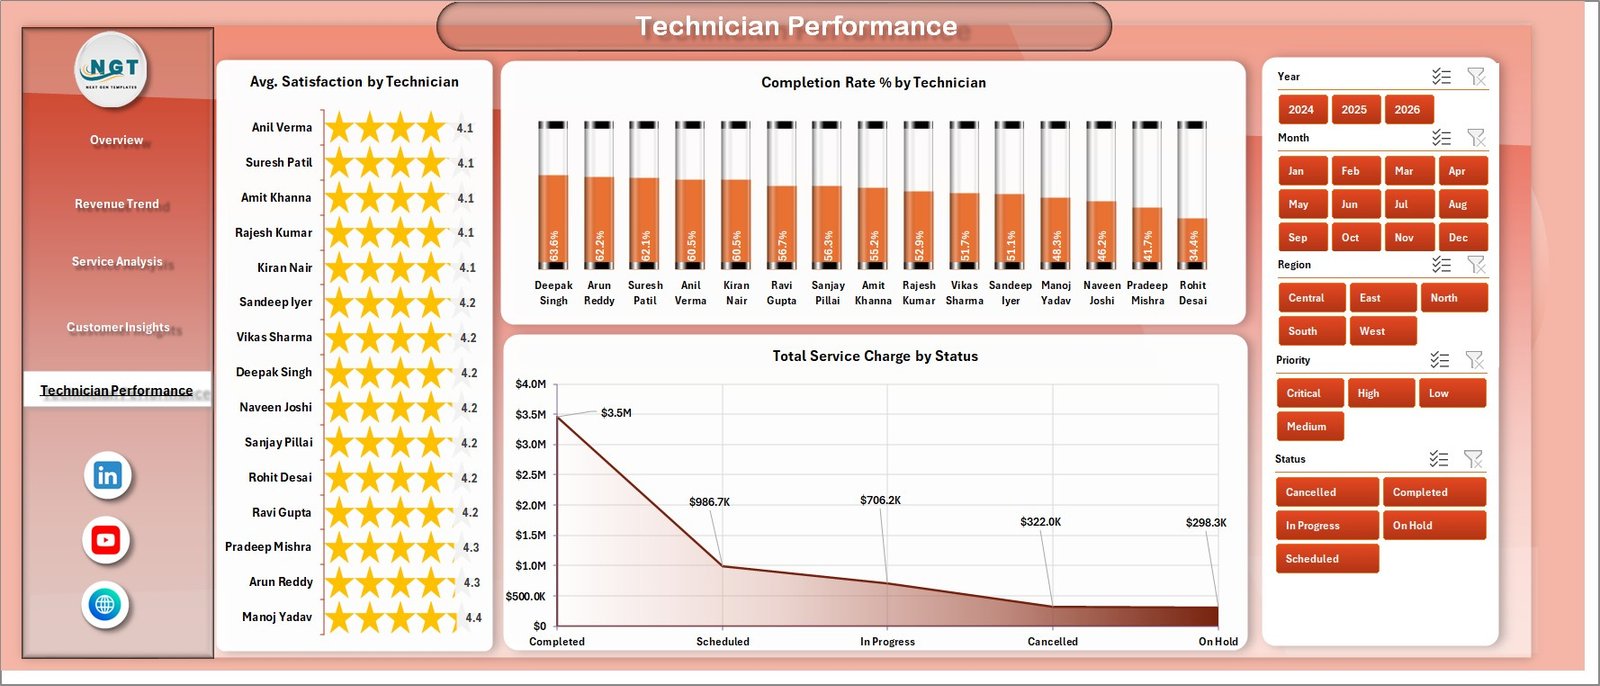 Technician Performance Page
The dedicated Technician Performance page ranks field staff across three dimensions simultaneously: Avg. Satisfaction by Technician reflects customer feedback scores; Completion Rate % by Technician measures job fulfilment reliability; and Total Service Charge by Status tracks revenue by job completion state. These three charts give managers everything needed for monthly performance reviews without pulling separate reports or logging into a SaaS dashboard.
Data Sheet
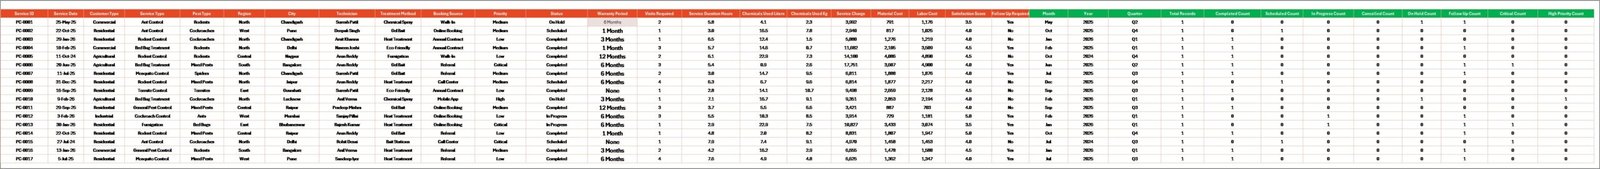 Data Sheet Tab
The Data Sheet is where all service records are entered. Add rows in the same column format as the sample data — service date, technician, region, city, customer type, pest type, treatment method, booking source, service charge, material cost, service hours, warranty period, priority, status, and satisfaction score. Every pivot table in the workbook reads from this single source of truth.
Support Sheet
 Support Sheet Tab
The Support Sheet contains all pivot tables powering the dashboard charts. Once familiar with the file, keep this sheet hidden during day-to-day use. After updating the Data Sheet, click Data → Refresh All to refresh all pivots and update every visual across all 5 pages instantly. No VBA or macro interaction is required.
Pest Control Dashboard in Excel vs. Google Sheets vs. ServiceTitan — Feature Comparison
| Feature | Pest Control Dashboard in Excel | Google Sheets Tracker | ServiceTitan / Jobber |
|---|---|---|---|
| Cost | $17.99 one-time ✅ | Free (manual build) | $149–$399+/month |
| Setup Time | Under 10 minutes ✅ | Hours of manual build | Days of onboarding |
| Pre-Built Charts | 16+ pivot charts ✅ | Build yourself | Built-in reporting |
| Works Offline | Yes ✅ | No | No |
| Technician Performance Page | Dedicated page ✅ | Manual only | Yes (enterprise) |
| Multi-Slicer Filtering | Yes ✅ | Dropdown only | Yes |
| Year-1 Cost (5 users) | $17.99 total ✅ | Free (time cost) | $9,000–$24,000+ |
For pest control businesses that want financial and technician analytics without a $149+/month SaaS subscription, the Pest Control Dashboard in Excel sits in the sweet spot.
Who Should Use This Template
Perfect for:
- Pest control business owners managing 1–50 technicians across multiple service regions
- Operations managers reviewing monthly revenue, profitability, and technician KPIs
- Field service managers tracking booking sources, customer types, and priority fulfillment
- Small-to-medium exterminator and fumigation companies replacing manual spreadsheet reporting
Not a fit if:
- You need real-time dispatch, GPS tracking, or automated invoicing (ServiceTitan or Jobber)
- Your team requires customer-facing mobile app integration
- You want fully automated zero-data-entry analytics with no manual updates
Real-World Use Cases
Marcus runs a pest control company with 8 technicians across 3 cities. He uses the Pest Control Dashboard in Excel for his weekly management review — Net Profit by Technician and Completion Rate side by side, so he immediately knows which team members need coaching and which should be assigned to higher-value commercial accounts.
A regional franchise owner exports monthly data from their booking system as CSV, pastes it into the Data Sheet, and hits Refresh All. In under five minutes the full 5-page dashboard reflects the latest period — ready to share with the franchisor as part of quarterly performance reporting, without paying for an additional analytics module.
Advantages of the Pest Control Dashboard in Excel
- 🗂️ Single file, all insights — no toggling between different reports or applications
- ⚡ Instant refresh — one click updates all 16+ charts after data entry
- 💰 One-time cost — $17.99 vs. $149–$399/month for SaaS analytics platforms
- 🔒 Offline and private — no cloud upload, no third-party data access
- 🛠️ Fully customizable — extend with new columns, service categories, or pivot fields without breaking the dashboard
Opportunities for Improvement
- The dashboard does not include route optimization or job scheduling — a dedicated field service platform is needed for dispatch alongside this file
- Real-time data requires manual CSV export and paste from your booking system; there is no automatic data connector
- The file is optimized for Excel desktop; some slicer interactions may be limited in Excel Online
Best Practices
- Standardize data entry — use consistent pest type names, technician names, and city spellings so pivot grouping remains clean and charts don’t split identical values into separate rows
- Archive annually — start a fresh file each January and retain the prior year for benchmarking trend lines
- Protect the Support Sheet from accidental edits — right-click the tab and apply a simple password protection
- Use the Technician Performance page in monthly 1:1s — screenshot and paste into a slide for structured performance conversations
Explore Relevant Templates
Looking for more field service and operations analytics templates? These related posts and products may also be useful:
- Auto Repair Dashboard in Excel — service business analytics for repair shops with job, technician, and revenue tracking
- Plumbing Contractor Dashboard in Excel — the same pivot-driven architecture applied to plumbing contractor operations
- Facilities Management Report in Excel — multi-site facility performance reporting with maintenance and compliance tracking
Frequently Asked Questions
What KPIs does the Pest Control Dashboard in Excel track?
The Pest Control Dashboard in Excel tracks 5 KPI cards: Total Service Charge, Total Services, Net Profit, Avg. Satisfaction Score, and Avg. Charge Per Service. Across all 5 analysis pages, 16+ charts also cover revenue by month, service hours, chemical usage by pest type, completion rate, and technician-level performance.
Do I need Excel skills to use this dashboard?
Basic Excel familiarity is enough. The only technical step is clicking Data → Refresh All after updating the Data Sheet. All slicers work with a single click, and no formulas need modification. PK’s tutorials at YouTube.com/@PKAnExcelExpert include full step-by-step video walkthroughs for this exact type of pivot dashboard.
How do I add new service data to the dashboard?
Add new rows to the Data Sheet following the same column structure as the sample data. Then click Data → Refresh All in the Excel Ribbon. All pivot tables, charts, and KPI cards across all 5 pages update instantly — no manual chart editing or formula adjustment required.
Can this dashboard handle multiple technicians and service regions?
Yes. The dashboard includes Total Services by Region, Service Charge by City, Net Profit by Technician, Completion Rate % by Technician, and Avg. Satisfaction by Technician. Slicers allow filtering all charts to any individual technician or region simultaneously.
How does the Pest Control Dashboard compare to ServiceTitan or Jobber analytics?
ServiceTitan and Jobber are full field service platforms at $149–$399+/month covering real-time dispatch, scheduling, invoicing, and reporting. The Pest Control Dashboard in Excel is a $17.99 one-time analytics workbook covering financial performance and technician KPIs — it doesn’t replace scheduling software but delivers the same core analytics at a fraction of the ongoing cost.
What Excel version is required for this dashboard?
Microsoft Excel 2016 or later, including Microsoft 365. Pivot table slicers require Excel 2010+. No VBA or macros are used, so no security warnings appear when opening the file on any compliant Excel version.
About the Author
Built by PK — Microsoft Certified Professional with 15+ years of Excel, Google Sheets, and Power BI experience. Founder of NextGenTemplates, reaching 300K+ subscribers across YouTube channels. Every template is hand-built and tested before release.
Conclusion
The Pest Control Dashboard in Excel gives pest control business owners and operations managers a clear, filterable view of revenue, service performance, and technician output — without a monthly SaaS subscription, without complex setup, and without cloud dependency.
Click here to Purchase the Pest Control Dashboard in Excel — Instant download · One-time payment · No subscription
🎥 Watch step-by-step tutorials: Youtube.com/@PK-AnExcelExpert
📅 Last updated: May 2026