The Blockchain & Cryptocurrency Report in Excel gives finance, compliance, and operations teams a structured, visual reporting framework for tracking crypto transaction data inside Microsoft Excel. The template spans 3 working sheets — Summary Page, Report Page, and Data Sheet — plus a Support Sheet, with 5 pre-built charts, 5 KPI summary cards, and a dual-slicer architecture that filters every metric in one click. Setup takes under 10 minutes: paste your transaction data into the Data Sheet and the entire report updates automatically.
According to Microsoft Learn, Excel slicers are among the most efficient tools for visual data filtering — especially in financial and operational reporting workflows. This report leverages that native capability to deliver enterprise-level blockchain visibility without enterprise-level cost or setup.
🌍 Join 8,400+ teams in 40+ countries using NextGenTemplates to replace paid SaaS tools with one-time-purchase Excel, Google Sheets, Power BI, and HTML templates. Instant download · One-time payment · No subscription.
Key Features of the Blockchain & Cryptocurrency Report in Excel
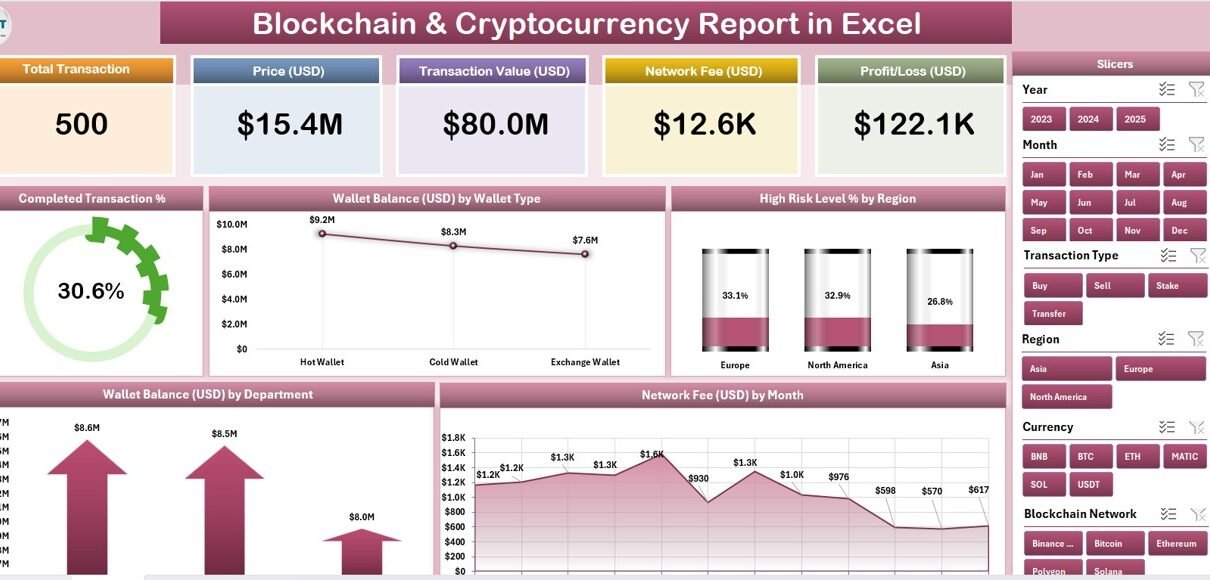
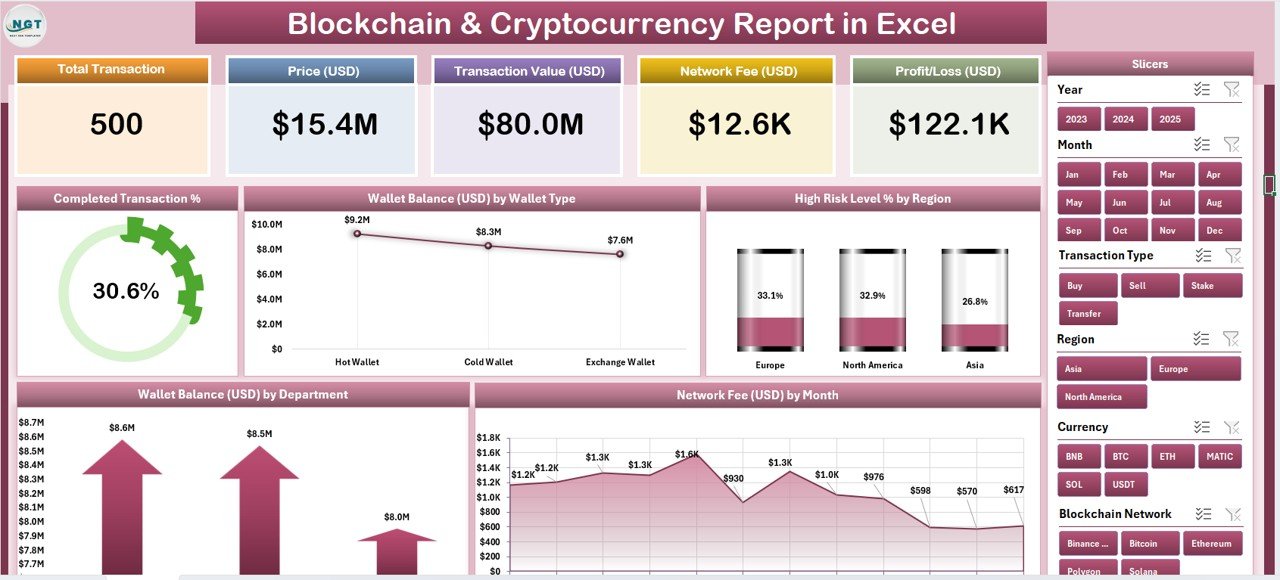
5 Pre-Built Analytical Charts. This report delivers five targeted blockchain visualizations that update automatically when new transaction data is entered: Completed Transaction %, Wallet Balance by Wallet Type, High Risk Level % by Region, Wallet Balance by Department, and Network Fee by Month. Each chart is fully linked to the Data Sheet — no pivot table rebuilding or manual refresh required.
5 KPI Summary Cards. The Summary page opens with five executive-facing metric cards giving an immediate read on total wallet balance, completed transaction rates, average network fees, and regional risk exposure. This is the report view built for board presentations, weekly stand-ups, and compliance check-ins.
Dual Slicer Architecture. A right-side slicer on the Summary page and a left-side slicer on the Report page deliver one-click filtering across every chart and metric. Analysts can slice by wallet type, region, department, or time period without touching formulas — eliminating the 30+ minutes per cycle that manual filter adjustment typically costs.
Risk Intelligence by Region. The High Risk Level % by Region chart is the compliance standout. It surfaces which geographic segments carry the highest transaction risk exposure, giving risk officers the visual evidence needed to prioritize audits, flag suspicious activity, and respond to regulatory requests — without querying raw transaction rows.
No Macros, No Add-ins Required. The Blockchain & Cryptocurrency Report in Excel is 100% built on native Excel features: slicers, structured tables, and embedded charts. It runs on Excel 2016, Excel 2019, and Microsoft 365 without any VBA, Power Query, or third-party plugins.
Dashboard Pages Explanation
Page 1 — Summary Page: The main executive dashboard. Five KPI cards run across the top, displaying headline metrics at a glance. A right-side slicer panel lets users filter all five charts simultaneously by any categorical dimension. The five charts — Completed Transaction %, Wallet Balance by Wallet Type, High Risk Level % by Region, Wallet Balance by Department, and Network Fee by Month — are arranged for a logical top-to-bottom read: transaction health first, then asset distribution, then risk exposure, then cost trends.
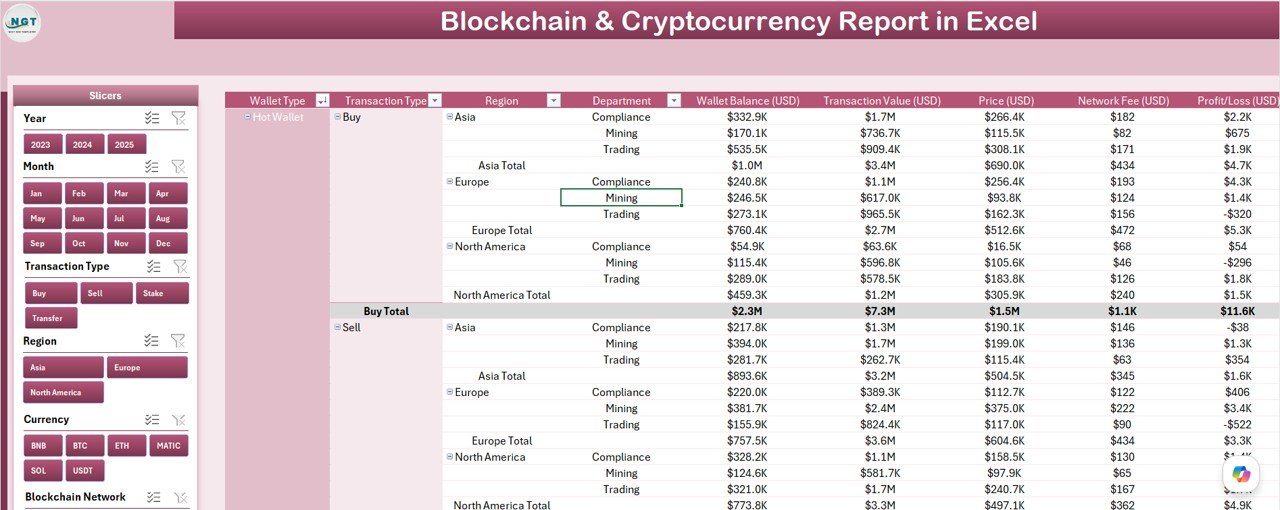
Page 2 — Report Page: A granular information table paired with a left-side slicer. This page is built for operations and compliance analysts who need transaction-level detail beyond what charts can show. The table supports slicer-driven filtering by transaction status, wallet type, risk level, department, and region — making it the go-to view for audit responses, investigation workflows, and drill-down analysis.
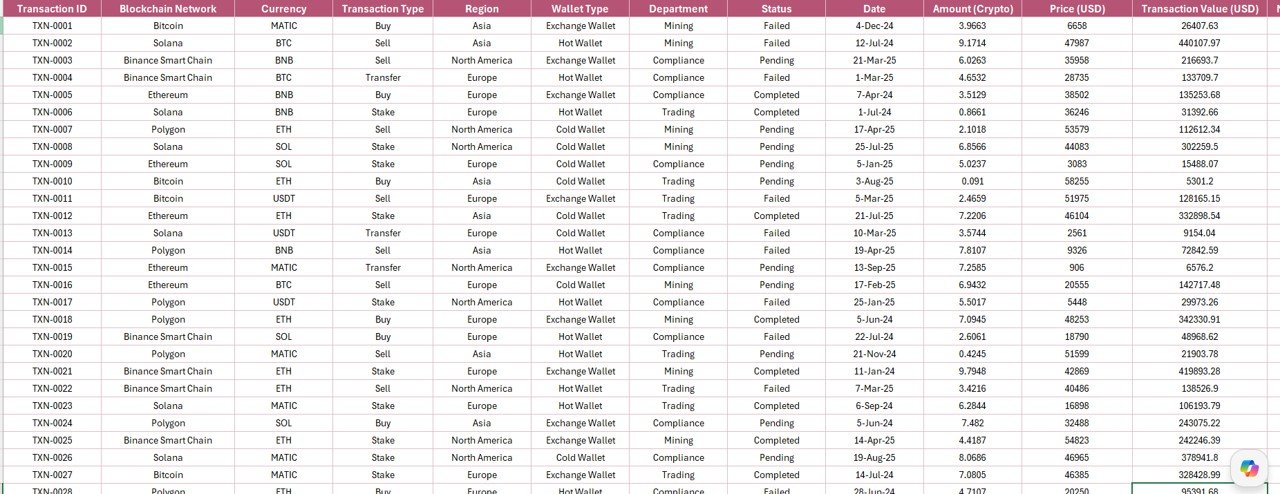
Data Sheet: The structured input table where raw blockchain transaction records are entered or pasted. Columns include transaction ID, date, wallet type, department, region, risk level, network fee, and completion status. The table auto-expands as rows are added, with all charts and the Report Page pulling directly from this range — no formula updates needed.
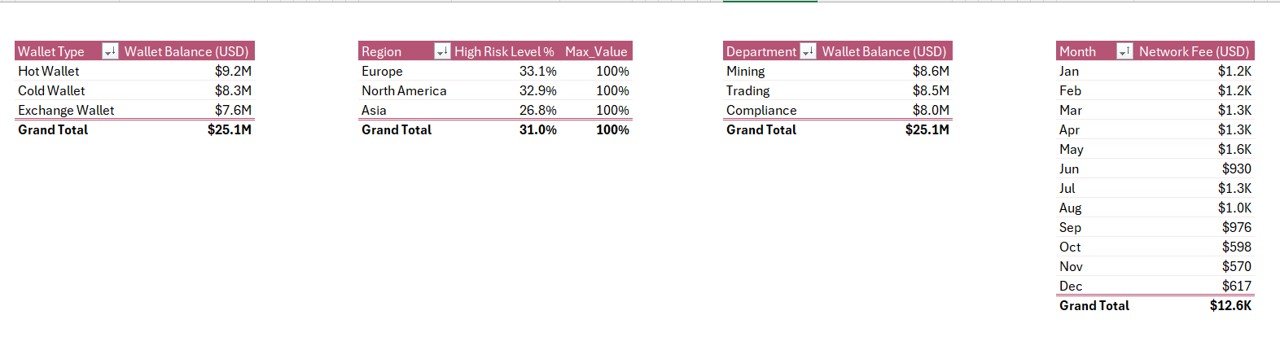
Support Sheet: Contains the lookup tables, dropdown reference values, and category lists that drive the slicer options, chart dimensions, and Data Sheet dropdowns. Teams can add new wallet types, regions, or departments here without breaking any of the chart or slicer logic.
Blockchain & Cryptocurrency Report in Excel vs. Google Sheets vs. Paid Blockchain SaaS — Feature Comparison
| Feature | Blockchain & Cryptocurrency Report in Excel | Google Sheets Equivalent | Chainalysis / Glassnode |
|---|---|---|---|
| Cost | $7.99 one-time | Free (limited charts) | $500–$5,000+/month |
| Platform | Microsoft Excel (offline/online) | Google Sheets (browser only) | Proprietary web app |
| Setup time | Under 10 minutes | 15–30 minutes (manual build) | Days (API/dev integration) |
| Dual Interactive Slicers | ✅ Yes (Summary + Report pages) | ⚠️ Limited native filter options | ✅ Advanced filters |
| Risk by Region Chart | ✅ Built-in | ❌ Manual build required | ✅ Premium tier only |
| Customizable Fields | ✅ Full control via Support Sheet | ✅ Yes | ❌ Fixed proprietary schemas |
| 100% Offline Access | ✅ Yes | ❌ Requires internet | ❌ Requires internet |
| Year-1 Cost (5 users) | $7.99 total | $0 (basic Sheets only) | $6,000–$60,000+ |
| No Coding / API Required | ✅ Native Excel only | ✅ Yes | ❌ API/dev skills required |
For finance and compliance teams that need structured blockchain reporting without paying enterprise SaaS prices, the Blockchain & Cryptocurrency Report in Excel sits in the sweet spot between free Sheets limitations and $500+/month enterprise platforms.
Who Should Use This Template
Perfect for:
- Finance managers at blockchain startups and fintech firms tracking crypto wallet balances and transaction completion rates across departments
- Compliance officers who need to visualize High Risk Level % by Region for regulatory reporting and internal audit purposes
- Blockchain project leads at DeFi platforms or payment networks monitoring network fee trends and transaction throughput KPIs
- Data analysts who live in Excel and want a ready-built crypto reporting framework rather than building one from scratch
- Small-to-mid-size teams (5–500 people) needing structured blockchain reporting without the cost or complexity of enterprise SaaS
Not a fit if:
- You need live API connections to blockchain nodes for real-time on-chain data (this is an offline reporting template for structured data you already export)
- Your organization requires automated AML screening or wallet address monitoring (consider enterprise compliance platforms for those needs)
- You need simultaneous multi-user cloud editing (explore our Google Sheets Dashboard Templates as an alternative)
Real-World Use Cases
Priya manages finance at a 120-person blockchain payment startup. Every Monday morning she exports last week’s transaction log from their payments platform, pastes it into the Data Sheet, and her Summary Page instantly shows the updated Completed Transaction % chart, refreshed Network Fee by Month trend, and five KPI cards with total wallet balances. Her board report for weekly leadership meetings is ready in under 15 minutes — no formula edits, no pivot table rebuilding.
James is a compliance analyst at a crypto exchange. During quarterly regulatory audits, he uses the High Risk Level % by Region chart in the Blockchain & Cryptocurrency Report in Excel to identify which geographic segments triggered the most risk flags. The left-side slicer on the Report Page lets him drill into individual regions and wallet types to find the specific transaction records auditors are asking about — in seconds, not hours of spreadsheet searching.
A three-person DeFi fund operations team tracks hot and cold wallet balances across asset custody departments using the Wallet Balance by Department and Wallet Balance by Wallet Type charts. Their $7.99 one-time purchase replaced a $2,400/year subscription to a dashboard tool that offered features they never actually needed for their workflow.
Advantages of the Blockchain & Cryptocurrency Report in Excel
- Zero learning curve — built entirely in Excel; any analyst comfortable with spreadsheets can use it immediately
- 5 charts pre-configured — no chart setup, axis labeling, or color formatting required out of the box
- Dual slicers — one on each reporting page provides filtering flexibility that manual dropdowns can’t match
- Risk visibility — the regional risk chart is a compliance asset that takes weeks to build from scratch in standard Excel
- Offline-first — no internet dependency means sensitive transaction data never leaves your machine unless you choose to share it
- One-time cost — $7.99 with no recurring subscription, no per-user fee, and no expiry
Opportunities for Improvement
Like all Excel-based reporting tools, this template has a few honest limitations worth noting. It does not connect to blockchain APIs or live data feeds — data must be exported from your source system and pasted into the Data Sheet manually or via Power Query. The template is designed for structured tabular transaction data; teams with complex multi-chain or cross-ledger data may need to pre-consolidate records before input. And while the Support Sheet is customizable, users adding entirely new chart types or report pages will need intermediate Excel skills to extend the framework.
Best Practices
- Standardize your export format — map your source system’s column headers to the Data Sheet fields once, then use that export format every reporting cycle to avoid re-mapping
- Update the Support Sheet first — if you’re adding new wallet types or regions, update those lists before pasting transaction data to ensure slicer options populate correctly
- Use the Summary Page for stakeholder views — save the workbook after updating data, then share only the Summary page as a PDF or screenshot for board and leadership audiences
- Archive monthly snapshots — save a copy of the workbook at the end of each month before overwriting data to maintain a historical record of blockchain reporting
- Add data validation to the Data Sheet — Excel’s data validation dropdowns (referencing Support Sheet lists) prevent typos and ensure consistent slicer categorization across reporting periods
Explore Relevant Templates
Looking for more blockchain and cryptocurrency analysis tools? Explore these related templates:
- 🔗 Crypto Portfolio Dashboard in Excel — portfolio-level cryptocurrency tracking with asset allocation charts and return analysis
- 🔗 Digital Wallets KPI Dashboard in Excel — wallet-centric KPI monitoring with trend charts and performance indicators
- 🔗 Blockchain Finance Dashboard in Power BI — Power BI version for teams preferring cloud-connected reporting
- 📌 Browse all Excel Dashboard Templates on NextGenTemplates for finance, operations, IT, and more
Frequently Asked Questions
What KPIs does the Blockchain & Cryptocurrency Report in Excel track?
The Blockchain & Cryptocurrency Report in Excel tracks 5 core metrics: Completed Transaction %, Wallet Balance by Wallet Type, High Risk Level % by Region, Wallet Balance by Department, and Network Fee by Month. All metrics display as KPI cards and interactive charts that update automatically when you replace the sample data in the Data Sheet.
Does this template require macros or Excel add-ins?
No. The Blockchain & Cryptocurrency Report in Excel is built entirely with native Excel features — slicers, structured tables, and embedded charts. No VBA macros, Power Query, or third-party add-ins are required. The template runs on Excel 2016, 2019, and Microsoft 365.
Can I add more transaction rows to the Data Sheet?
Yes. The Data Sheet uses an Excel table that automatically expands as new rows are added. All five charts and the Report Page information table pull from the full table range, so adding new transaction records updates every visual without any formula edits.
How does this compare to Chainalysis or Glassnode?
Chainalysis and Glassnode are enterprise on-chain analytics platforms that start at $500 to $5,000+ per month and require API or developer integration. The Blockchain & Cryptocurrency Report in Excel is an offline, one-time $7.99 download built for teams that track their own structured transaction exports rather than querying live blockchain nodes.
Can I customize the wallet types, regions, and departments in this report?
Yes. The Support Sheet contains all the reference lists that power the slicer options and chart categories. You can add, rename, or remove wallet types, regions, and departments in the Support Sheet, and all slicers, charts, and dropdown validations in the Data Sheet will reflect the updated categories automatically.
Is this template suitable for DeFi, NFT, or stablecoin tracking?
The Blockchain & Cryptocurrency Report in Excel is a flexible transaction reporting framework. DeFi teams, NFT projects, and stablecoin operators can relabel the wallet type, department, and region categories in the Support Sheet to match their specific asset classes and reporting taxonomy.
How long does initial setup take?
Initial setup takes under 10 minutes: download the file, open in Excel, paste your transaction data into the Data Sheet, optionally update the Support Sheet category lists to match your taxonomy, and both the Summary Page and Report Page are immediately ready to use with your real data.
About the Author
Built by PK — Microsoft Certified Professional with 15+ years of Excel, Google Sheets, and Power BI experience. Founder of NextGenTemplates, reaching 300K+ subscribers across YouTube channels (@PK-AnExcelExpert, @NextGenTemplates, @NeoTechNavigators). Every template is hand-built and tested before release.
Conclusion
The Blockchain & Cryptocurrency Report in Excel is the fastest way for finance and compliance teams to turn raw crypto transaction exports into a structured, visual report without enterprise software costs or developer dependencies. Five pre-built charts, dual interactive slicers, a risk-by-region visualization, and a clean four-sheet architecture make this the go-to reporting tool for blockchain data in Excel.
🛝 Click here to Purchase the Blockchain & Cryptocurrency Report in Excel — Instant download · One-time payment · No subscription.
For step-by-step tutorials, visit Youtube.com/@PK-AnExcelExpert
📅 Last updated: May 2026