In today's rapidly evolving corporate world, the need for an efficient training and development program is crucial for enhancing employee
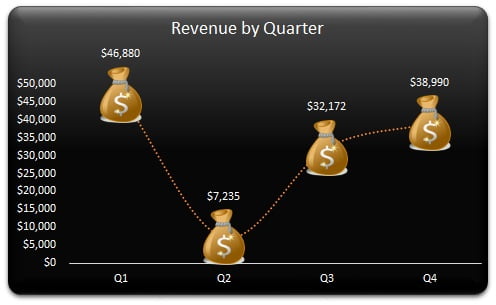
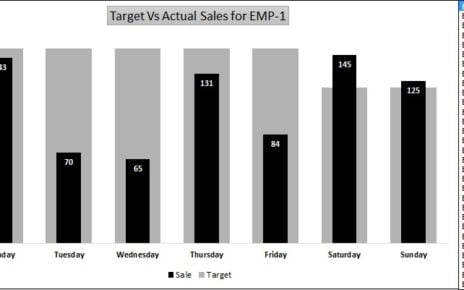
When it comes to tracking sales performance, a dynamic and interactive chart is often the best way to go. In this
The Employee Retirement Notification Tracker in Excel manages 8 connected worksheets that help HR teams track upcoming employee retirements across